Comcast 2009 Annual Report Download - page 39
Download and view the complete annual report
Please find page 39 of the 2009 Comcast annual report below. You can navigate through the pages in the report by either clicking on the pages listed below, or by using the keyword search tool below to find specific information within the annual report.-
 1
1 -
2
-
3
-
4
-
5
-
6
-
7
-
8
-
9
-
10
-
11
-
12
-
13
-
14
-
15
-
16
-
17
-
18
-
19
-
20
-
21
-
22
-
23
-
24
-
25
-
26
-
27
-
28
-
 29
29 -
 30
30 -
 31
31 -
 32
32 -
 33
33 -
 34
34 -
 35
35 -
 36
36 -
 37
37 -
 38
38 -
 39
39 -
 40
40 -
 41
41 -
 42
42 -
 43
43 -
 44
44 -
 45
45 -
 46
46 -
 47
47 -
 48
48 -
 49
49 -
50
-
51
-
52
-
53
-
54
-
55
-
56
-
57
-
58
-
59
-
60
-
61
-
62
-
63
-
64
-
65
-
66
-
67
-
68
-
69
-
70
-
71
-
72
-
73
-
74
-
75
-
76
-
77
-
78
-
79
-
80
-
81
-
82
-
83
-
84
-
85
-
86
-
87
-
88
-
89
-
90
-
91
-
92
-
93
-
94
-
95
-
96
-
97
-
98
-
99
-
100
-
101
-
102
-
103
-
104
-
105
-
106
-
107
-
108
-
109
-
110
-
111
-
112
-
113
-
114
-
115
-
116
-
117
-
118
-
119
-
120
-
121
-
122
-
123
-
124
-
125
-
126
-
127
-
128
-
129
-
130
-
131
-
132
-
133
-
134
-
135
-
136
-
137
-
138
-
139
-
140
-
141
-
142
-
143
-
144
-
145
-
146
-
147
-
148
-
149
-
150
-
151
-
152
-
153
-
154
-
155
-
156
-
157
-
158
-
159
-
160
-
161
-
162
-
163
-
164
-
165
-
166
-
167
-
168
-
169
-
170
-
171
-
172
-
173
-
174
-
175
-
176
-
177
-
178
-
179
-
180
-
181
-
182
-
183
-
184
-
185
-
186
-
187
-
188
-
189
-
190
-
191
-
192
-
193
-
194
-
195
-
196
-
197
-
198
-
199
-
200
-
201
-
202
-
203
-
204
-
205
-
206
-
207
-
208
-
209
-
210
-
211
-
212
-
213
-
214
-
215
-
216
-
217
-
218
-
219
-
220
-
221
-
222
-
223
-
224
-
225
-
226
-
227
-
228
-
229
-
230
-
231
 |
 |

Table of Contents
31
Comcast 2009 Annual Report on Form 10-
K
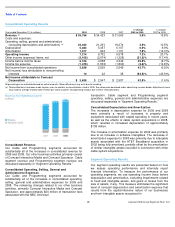
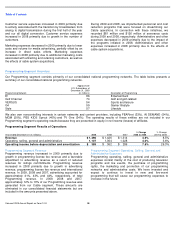
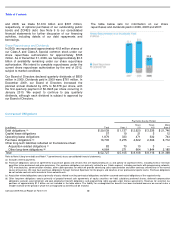
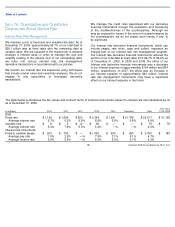
Capital Expenditures
Our most significant recurring investing activity has been
capital expenditures in our Cable segment, and we expect
that this will continue in the future. A significant portion of our
capital expenditures is based on the level of customer growth
and the technology being deployed. The table below
summarizes the capital expenditures we incurred in our
Cable segment from 2007 through 2009.
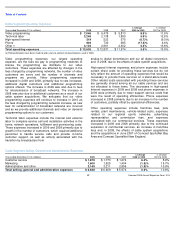
Cable capital expenditures decreased 9.2% and 7.5% in
2009 and 2008, respectively, primarily due to fewer
residential unit additions and improved equipment pricing,
partially offset by an increased investment in our commercial
services and strategic initiatives like our all digital conversion
and DOCSIS 3.0 wideband technology. Line extensions
decreased in 2009 and 2008 primarily due to the slowdown in
the housing market.
Capital expenditures in our Programming segment were not
significant in 2009, 2008 or 2007. In 2008 and 2007, our
other
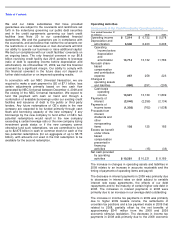
Year ended December 31
(in millions)
2009
2008
2007
Customer premises
equipment
$
2,934
$
3,147
$
3,164
Scalable infrastructure
855
1,024
1,014
Line extensions
120
212
352
Support capital
421
522
792
Upgrades (capacity
expansion)
356
407
520
Commercial services
351
233
151
Total
$
5,037
$
5,545
$
5,993
(a)
Customer premises equipment (“CPE”)
includes costs incurred to connect our
services at the customer’
s home. The equipment deployed typically includes
standard digital set-top boxes, HD set-
top boxes, digital video recorders,
digital transport adapters, remote controls and modems. CPE also includes
the cost of installing this equipment for new customers as well as the material
and labor cost incurred to install the cable that connects a customer’
s dwelling
to the distribution system.
(b)
Scalable infrastructure includes costs incurred to secure growth in customers
or revenue units or to provide service enhancements, other than those related
to CPE. Scalable infrastructure includes equipment that controls signal
reception, processing and transmission throughout our distribution system, as
well as equipment that controls and communicates with the CPE residing
within a customer
’
s home. Also included in scalable infrastructure is certain
equipment necessary for content aggregation and distribution (video on
demand equipment) and equipment necessary to provide certain video, high-
speed Internet and phone service features (e.g., voice mail and e-mail).
(c)
Line extensions include the costs of extending our distribution system into new
service areas. These costs typically include network design, the purchase and
installation of fiber-optic and coaxial cable, and certain electronic equipment.
(d)
Support capital includes costs associated with the replacement or
enhancement of non-
distribution system assets due to technical or physical
obsolescence and wear-
out. These costs typically include vehicles, computer
and office equipment, furniture and fixtures, tools, and test equipment.
(e)
Upgrades include costs to enhance or replace existing portions of our
distribution system, including recurring improvements.
(f)
Commercial services include the costs incurred related to the rollout of our
services to small and medium-
sized businesses. The equipment typically
includes modems and the cost of installing this equipment for new customers
as well as materials and labor incurred to install the cable that connects a
customer’s business to the closest point of the main distribution network.
(a)
(b)
(c)
(d)
(e)
(f)
business activities included approximately $137 million and
$110 million, respectively, of capital expenditures related to
the consolidation of offices and the relocation of our
corporate headquarters.
Capital expenditures for 2010 and for subsequent years will
depend on numerous factors, including acquisitions,
competition, changes in technology, regulatory changes and
the timing and rate of deployment of new services.
Acquisitions
Our 2009 acquisitions were not significant. In 2008,
acquisitions were primarily related to our acquisition of an
additional interest in Comcast SportsNet Bay Area, our
acquisition of the remaining interest in G4 that we did not
already own, and our acquisitions of Plaxo and DailyCandy.
In 2007, acquisitions were primarily related to our
acquisitions of Patriot Media, Fandango, Comcast SportsNet
New England and an interest in Comcast SportsNet Bay
Area.
Proceeds from Sales of Investments
In 2008, proceeds from the sales of investments were
primarily related to the disposition of available-for-sale debt
securities. In 2007, proceeds from the sales of investments
were primarily related to the disposition of our ownership
interests in Time Warner Inc.
Purchases of Investments
In 2009, purchases of investments consist primarily of our
additional investment in Clearwire. In 2008, purchases of
investments consisted primarily of the funding of our initial
investment in Clearwire. In 2007, purchases of investments
consisted primarily of an additional investment in Insight
Midwest, L.P. and the purchase of available-for-sale debt
securities.
Financing Activities
Net cash used in financing activities consists primarily of our
debt repayments, our repurchases of our Class A and
Class A Special common stock and dividend payments,
partially offset by our proceeds from borrowings. Proceeds
from borrowings fluctuate from year to year based on the
amounts paid to fund acquisitions and debt repayments.
In July 2009, we completed a cash tender to purchase
approximately $1.3 billion aggregate principal amount of
certain of our outstanding notes for approximately $1.5
billion. We recognized additional interest expense of
approximately $180 million primarily associated with the
premiums incurred in the tender offer. The premiums related
to the tender offer are included in other financing activities.
We have made, and may from time to time in the future
make, optional repayments on our debt obligations, which
may include repurchases of our outstanding public notes and
debentures, depending on various factors, such as market
conditions. In 2009