Comcast 2009 Annual Report Download - page 48
Download and view the complete annual report
Please find page 48 of the 2009 Comcast annual report below. You can navigate through the pages in the report by either clicking on the pages listed below, or by using the keyword search tool below to find specific information within the annual report.-
 1
1 -
2
-
3
-
4
-
5
-
6
-
7
-
8
-
9
-
10
-
11
-
12
-
13
-
14
-
15
-
16
-
17
-
18
-
19
-
20
-
21
-
22
-
23
-
24
-
25
-
26
-
27
-
28
-
29
-
30
-
31
-
32
-
33
-
34
-
35
-
36
-
37
-
 38
38 -
 39
39 -
 40
40 -
 41
41 -
 42
42 -
 43
43 -
 44
44 -
 45
45 -
 46
46 -
 47
47 -
 48
48 -
 49
49 -
 50
50 -
 51
51 -
 52
52 -
 53
53 -
 54
54 -
 55
55 -
 56
56 -
 57
57 -
 58
58 -
59
-
60
-
61
-
62
-
63
-
64
-
65
-
66
-
67
-
68
-
69
-
70
-
71
-
72
-
73
-
74
-
75
-
76
-
77
-
78
-
79
-
80
-
81
-
82
-
83
-
84
-
85
-
86
-
87
-
88
-
89
-
90
-
91
-
92
-
93
-
94
-
95
-
96
-
97
-
98
-
99
-
100
-
101
-
102
-
103
-
104
-
105
-
106
-
107
-
108
-
109
-
110
-
111
-
112
-
113
-
114
-
115
-
116
-
117
-
118
-
119
-
120
-
121
-
122
-
123
-
124
-
125
-
126
-
127
-
128
-
129
-
130
-
131
-
132
-
133
-
134
-
135
-
136
-
137
-
138
-
139
-
140
-
141
-
142
-
143
-
144
-
145
-
146
-
147
-
148
-
149
-
150
-
151
-
152
-
153
-
154
-
155
-
156
-
157
-
158
-
159
-
160
-
161
-
162
-
163
-
164
-
165
-
166
-
167
-
168
-
169
-
170
-
171
-
172
-
173
-
174
-
175
-
176
-
177
-
178
-
179
-
180
-
181
-
182
-
183
-
184
-
185
-
186
-
187
-
188
-
189
-
190
-
191
-
192
-
193
-
194
-
195
-
196
-
197
-
198
-
199
-
200
-
201
-
202
-
203
-
204
-
205
-
206
-
207
-
208
-
209
-
210
-
211
-
212
-
213
-
214
-
215
-
216
-
217
-
218
-
219
-
220
-
221
-
222
-
223
-
224
-
225
-
226
-
227
-
228
-
229
-
230
-
231
 |
 |

Table of Contents
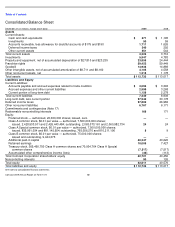
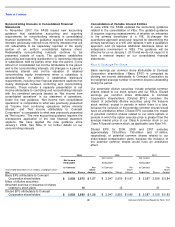
Consolidated Balance Sheet
See notes to consolidated financial statements.
December 31 (in millions, except share data)
2009
2008
Assets
Current Assets:
Cash and cash equivalents
$
671
$
1,195
Investments
50
59
Accounts receivable, less allowance for doubtful accounts of $175 and $190
1,711
1,626
Deferred income taxes
240
292
Other current assets
551
544
Total current assets
3,223
3,716
Investments
5,947
4,783
Property and equipment, net of accumulated depreciation of $27,810 and $23,235
23,855
24,444
Franchise rights
59,452
59,449
Goodwill
14,933
14,889
Other intangible assets, net of accumulated amortization of $8,711 and $8,160
4,105
4,558
Other noncurrent assets, net
1,218
1,178
Total assets
$
112,733
$
113,017
Liabilities and Equity
Current Liabilities:
Accounts payable and accrued expenses related to trade creditors
$
3,094
$
3,393
Accrued expenses and other current liabilities
2,999
3,268
Current portion of long-term debt
1,156
2,278
Total current liabilities
7,249
8,939
Long
-
term debt, less current portion
27,940
30,178
Deferred income taxes
27,800
26,982
Other noncurrent liabilities
6,767
6,171
Commitments and contingencies (Note 17)
Redeemable noncontrolling interests
166
171
Equity:
Preferred stock
—
authorized, 20,000,000 shares; issued, zero
—
—
Class A common stock, $0.01 par value — authorized, 7,500,000,000 shares;
issued, 2,428,533,911 and 2,426,443,484; outstanding, 2,063,073,161 and 2,060,982,734
24
24
Class A Special common stock, $0.01 par value — authorized, 7,500,000,000 shares;
issued, 835,991,034 and 881,145,954; outstanding, 765,056,270 and 810,211,190
8
9
Class B common stock, $0.01 par value — authorized, 75,000,000 shares;
issued and outstanding, 9,444,375
—
—
Additional paid-in capital
40,247
40,620
Retained earnings
10,005
7,427
Treasury stock, 365,460,750 Class A common shares and 70,934,764 Class A Special
common shares
(7,517
)
(7,517
)
Accumulated other comprehensive income (loss)
(46
)
(113
)
Total Comcast Corporation shareholders’ equity
42,721
40,450
Noncontrolling interests
90
126
Total equity
42,811
40,576
Total liabilities and equity
$
112,733
$
113,017
Comcast 2009 Annual Report on Form 10-K
40