Comcast 2009 Annual Report Download - page 71
Download and view the complete annual report
Please find page 71 of the 2009 Comcast annual report below. You can navigate through the pages in the report by either clicking on the pages listed below, or by using the keyword search tool below to find specific information within the annual report.-
 1
1 -
2
-
3
-
4
-
5
-
6
-
7
-
8
-
9
-
10
-
11
-
12
-
13
-
14
-
15
-
16
-
17
-
18
-
19
-
20
-
21
-
22
-
23
-
24
-
25
-
26
-
27
-
28
-
29
-
30
-
31
-
32
-
33
-
34
-
35
-
36
-
37
-
38
-
39
-
40
-
41
-
42
-
43
-
44
-
45
-
46
-
47
-
48
-
49
-
50
-
51
-
52
-
53
-
54
-
55
-
56
-
57
-
58
-
59
-
60
-
 61
61 -
 62
62 -
 63
63 -
 64
64 -
 65
65 -
 66
66 -
 67
67 -
 68
68 -
 69
69 -
 70
70 -
 71
71 -
 72
72 -
 73
73 -
 74
74 -
 75
75 -
 76
76 -
 77
77 -
 78
78 -
 79
79 -
 80
80 -
 81
81 -
82
-
83
-
84
-
85
-
86
-
87
-
88
-
89
-
90
-
91
-
92
-
93
-
94
-
95
-
96
-
97
-
98
-
99
-
100
-
101
-
102
-
103
-
104
-
105
-
106
-
107
-
108
-
109
-
110
-
111
-
112
-
113
-
114
-
115
-
116
-
117
-
118
-
119
-
120
-
121
-
122
-
123
-
124
-
125
-
126
-
127
-
128
-
129
-
130
-
131
-
132
-
133
-
134
-
135
-
136
-
137
-
138
-
139
-
140
-
141
-
142
-
143
-
144
-
145
-
146
-
147
-
148
-
149
-
150
-
151
-
152
-
153
-
154
-
155
-
156
-
157
-
158
-
159
-
160
-
161
-
162
-
163
-
164
-
165
-
166
-
167
-
168
-
169
-
170
-
171
-
172
-
173
-
174
-
175
-
176
-
177
-
178
-
179
-
180
-
181
-
182
-
183
-
184
-
185
-
186
-
187
-
188
-
189
-
190
-
191
-
192
-
193
-
194
-
195
-
196
-
197
-
198
-
199
-
200
-
201
-
202
-
203
-
204
-
205
-
206
-
207
-
208
-
209
-
210
-
211
-
212
-
213
-
214
-
215
-
216
-
217
-
218
-
219
-
220
-
221
-
222
-
223
-
224
-
225
-
226
-
227
-
228
-
229
-
230
-
231
 |
 |

Table of Contents
Comcast 2009 Annual Report on Form 10-K
62
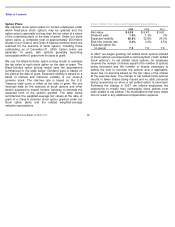
Option Plans
We maintain stock option plans for certain employees under
which fixed
-price stock options may be granted and the
option price is generally not less than the fair value of a share
of the underlying stock at the date of grant. Under our stock
option plans, a combined total of approximately 254 million
shares of our Class A and Class A Special common stock are
reserved for the exercise of stock options, including those
outstanding as of December 31, 2009. Option terms are
generally 10 years, with options generally becoming
exercisable within 5 years from the date of grant.
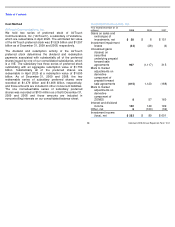
We use the Black-Scholes option pricing model to estimate
the fair value of each stock option on the date of grant. The
Black-Scholes option pricing model uses the assumptions
summarized in the table below. Dividend yield is based on
the yield at the date of grant. Expected volatility is based on a
blend of implied and historical volatility of our Class A
common stock. The risk-free rate is based on the U.S.
Treasury yield curve in effect at the date of grant. We use
historical data on the exercise of stock options and other
factors expected to impact holders’ behavior to estimate the
expected term of the options granted. The table below
summarizes the weighted-average fair values at the date of
grant of a Class A common stock option granted under our
stock option plans and the related weighted-average
valuation assumptions.
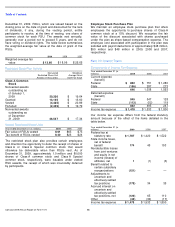
Stock Option Fair Value and Significant Assumptions
In 2007, we began granting net settled stock options instead
of stock options exercised with a cash payment (“cash settled
stock options”). In net settled stock options, an employee
receives the number of shares equal to the number of options
being exercised less the number of shares necessary to
satisfy the cost to exercise the options and, if applicable,
taxes due on exercise based on the fair value of the shares
at the exercise date. The change to net settled stock options
results in fewer shares being issued and no cash proceeds
being received by us when a net settled option is exercised.
Following the change in 2007, we offered employees the
opportunity to modify their outstanding stock options from
cash settled to net settled. The modifications that were made
did not result in any additional compensation expense.
2009
2008
2007
Fair value
$
4.93
$
6.47
$
9.61
Dividend yield
1.9
%
1.3
%
0
%
Expected volatility
36.8
%
32.8
%
24.3
%
Risk
-
free interest rate
2.4
%
3.0
%
4.5
%
Expected option life
(in years)
7.0
7.0
7.0