Comcast 2009 Annual Report Download - page 43
Download and view the complete annual report
Please find page 43 of the 2009 Comcast annual report below. You can navigate through the pages in the report by either clicking on the pages listed below, or by using the keyword search tool below to find specific information within the annual report.-
 1
1 -
2
-
3
-
4
-
5
-
6
-
7
-
8
-
9
-
10
-
11
-
12
-
13
-
14
-
15
-
16
-
17
-
18
-
19
-
20
-
21
-
22
-
23
-
24
-
25
-
26
-
27
-
28
-
29
-
30
-
31
-
32
-
 33
33 -
 34
34 -
 35
35 -
 36
36 -
 37
37 -
 38
38 -
 39
39 -
 40
40 -
 41
41 -
 42
42 -
 43
43 -
 44
44 -
 45
45 -
 46
46 -
 47
47 -
 48
48 -
 49
49 -
 50
50 -
 51
51 -
 52
52 -
 53
53 -
54
-
55
-
56
-
57
-
58
-
59
-
60
-
61
-
62
-
63
-
64
-
65
-
66
-
67
-
68
-
69
-
70
-
71
-
72
-
73
-
74
-
75
-
76
-
77
-
78
-
79
-
80
-
81
-
82
-
83
-
84
-
85
-
86
-
87
-
88
-
89
-
90
-
91
-
92
-
93
-
94
-
95
-
96
-
97
-
98
-
99
-
100
-
101
-
102
-
103
-
104
-
105
-
106
-
107
-
108
-
109
-
110
-
111
-
112
-
113
-
114
-
115
-
116
-
117
-
118
-
119
-
120
-
121
-
122
-
123
-
124
-
125
-
126
-
127
-
128
-
129
-
130
-
131
-
132
-
133
-
134
-
135
-
136
-
137
-
138
-
139
-
140
-
141
-
142
-
143
-
144
-
145
-
146
-
147
-
148
-
149
-
150
-
151
-
152
-
153
-
154
-
155
-
156
-
157
-
158
-
159
-
160
-
161
-
162
-
163
-
164
-
165
-
166
-
167
-
168
-
169
-
170
-
171
-
172
-
173
-
174
-
175
-
176
-
177
-
178
-
179
-
180
-
181
-
182
-
183
-
184
-
185
-
186
-
187
-
188
-
189
-
190
-
191
-
192
-
193
-
194
-
195
-
196
-
197
-
198
-
199
-
200
-
201
-
202
-
203
-
204
-
205
-
206
-
207
-
208
-
209
-
210
-
211
-
212
-
213
-
214
-
215
-
216
-
217
-
218
-
219
-
220
-
221
-
222
-
223
-
224
-
225
-
226
-
227
-
228
-
229
-
230
-
231
 |
 |

Table of Contents
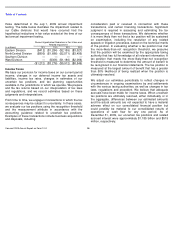
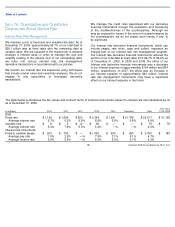
The table below summarizes the fair values and contract terms of financial instruments subject to interest rate risk maintained by us
as of December 31, 2009.
(in millions)
2010
2011
2012
2013
2014
Thereafter
Total
Fair Value
12/31/2009
Debt
Fixed rate
$
1,150
$
1,804
$
820
$
2,394
$
1,091
$
21,758
$
29,017
$
31,168
Average interest rate
5.7
%
6.2
%
9.5
%
8.8
%
5.0
%
6.8
%
6.9
%
Variable rate
$
6
$
5
$
12
$
56
$
—
$
—
$
79
$
79
Average interest rate
5.3
%
7.9
%
9.0
%
5.2
%
—
%
—
%
6.0
%
Interest rate instruments
Fixed to variable swaps
$
200
$
750
$
—
$
1,000
$
900
$
900
$
3,750
$
183
Average pay rate
1.5
%
2.6
%
—
%
7.9
%
3.1
%
5.1
%
4.7
%
Average receive rate
5.9
%
5.5
%
—
%
8.3
%
5.3
%
5.7
%
6.3
%
35
Comcast 2009 Annual Report on Form 10-
K
Item 7A: Quantitative and Qualitative
Disclosures About Market Risk
Interest Rate Risk Management
We maintain a mix of fixed-rate and variable-rate debt. As of
December 31, 2009, approximately 99.7% of our total debt of
$29.1 billion was at fixed rates with the remaining debt at
variable rates. We are exposed to the market risk of adverse
changes in interest rates. In order to manage the cost and
volatility relating to the interest cost of our outstanding debt,
we enter into various interest rate risk management
derivative transactions in accordance with our policies.
We monitor our interest rate risk exposures using techniques
that include market value and sensitivity analyses. We do not
engage in any speculative or leveraged derivative
transactions.
We manage the credit risks associated with our derivative
financial instruments through the evaluation and monitoring
of the creditworthiness of the counterparties. Although we
may be exposed to losses in the event of nonperformance by
the counterparties, we do not expect such losses, if any, to
be significant.
Our interest rate derivative financial instruments, which can
include swaps, rate locks, caps and collars, represent an
integral part of our interest rate risk management program.
Our interest rate derivative financial instruments reduced the
portion of our total debt at fixed rates from 99.7% to 86.9% as
of December 31, 2009. In 2009 and 2008, the effect of our
interest rate derivative financial instruments was a decrease
in our interest expense of approximately $104 million and $34
million, respectively. In 2007, the effect was an increase in
our interest expense of approximately $43 million. Interest
rate risk management instruments may have a significant
effect on our interest expense in the future.