Comcast 2009 Annual Report Download - page 37
Download and view the complete annual report
Please find page 37 of the 2009 Comcast annual report below. You can navigate through the pages in the report by either clicking on the pages listed below, or by using the keyword search tool below to find specific information within the annual report.-
 1
1 -
2
-
3
-
4
-
5
-
6
-
7
-
8
-
9
-
10
-
11
-
12
-
13
-
14
-
15
-
16
-
17
-
18
-
19
-
20
-
21
-
22
-
23
-
24
-
25
-
26
-
 27
27 -
 28
28 -
 29
29 -
 30
30 -
 31
31 -
 32
32 -
 33
33 -
 34
34 -
 35
35 -
 36
36 -
 37
37 -
 38
38 -
 39
39 -
 40
40 -
 41
41 -
 42
42 -
 43
43 -
 44
44 -
 45
45 -
 46
46 -
 47
47 -
48
-
49
-
50
-
51
-
52
-
53
-
54
-
55
-
56
-
57
-
58
-
59
-
60
-
61
-
62
-
63
-
64
-
65
-
66
-
67
-
68
-
69
-
70
-
71
-
72
-
73
-
74
-
75
-
76
-
77
-
78
-
79
-
80
-
81
-
82
-
83
-
84
-
85
-
86
-
87
-
88
-
89
-
90
-
91
-
92
-
93
-
94
-
95
-
96
-
97
-
98
-
99
-
100
-
101
-
102
-
103
-
104
-
105
-
106
-
107
-
108
-
109
-
110
-
111
-
112
-
113
-
114
-
115
-
116
-
117
-
118
-
119
-
120
-
121
-
122
-
123
-
124
-
125
-
126
-
127
-
128
-
129
-
130
-
131
-
132
-
133
-
134
-
135
-
136
-
137
-
138
-
139
-
140
-
141
-
142
-
143
-
144
-
145
-
146
-
147
-
148
-
149
-
150
-
151
-
152
-
153
-
154
-
155
-
156
-
157
-
158
-
159
-
160
-
161
-
162
-
163
-
164
-
165
-
166
-
167
-
168
-
169
-
170
-
171
-
172
-
173
-
174
-
175
-
176
-
177
-
178
-
179
-
180
-
181
-
182
-
183
-
184
-
185
-
186
-
187
-
188
-
189
-
190
-
191
-
192
-
193
-
194
-
195
-
196
-
197
-
198
-
199
-
200
-
201
-
202
-
203
-
204
-
205
-
206
-
207
-
208
-
209
-
210
-
211
-
212
-
213
-
214
-
215
-
216
-
217
-
218
-
219
-
220
-
221
-
222
-
223
-
224
-
225
-
226
-
227
-
228
-
229
-
230
-
231
 |
 |

Table of Contents
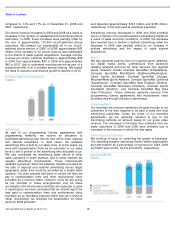
We and our Cable subsidiaries that have provided
guarantees are subject to the covenants and restrictions set
forth in the indentures governing our public debt securities
and in the credit agreements governing our bank credit
facilities (see Note 20 to our consolidated financial
statements). We and the guarantors are in compliance with
the covenants, and we believe that neither the covenants nor
the restrictions in our indentures or loan documents will limit
our ability to operate our business or raise additional capital.
We test our compliance with our credit facilities’ covenants on
an ongoing basis. The only financial covenant in our $6.8
billion revolving credit facility due 2013 pertains to leverage
(ratio of debt to operating income before depreciation and
amortization). As of December 31, 2009, we met this financial
covenant by a significant margin. Our ability to comply with
this financial covenant in the future does not depend on
further debt reduction or on improved operating results.
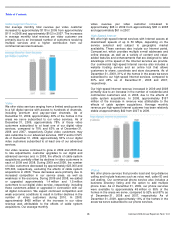
In connection with our NBC Universal transaction, we are
required to make a cash payment to GE of $7.1 billion, less
certain adjustments primarily based on free cash flow
generated by NBC Universal between December 4, 2009 and
the closing of the NBC Universal transaction. We expect to
fund this payment with cash on hand and through a
combination of available borrowings under our existing credit
facilities and issuance of debt to the public or third party
lenders. Any future redemptions of GE’s stake in the new
company are expected to be funded primarily through cash
flows and borrowing capacity of the new company. If any
borrowings by the new company to fund either of GE’s two
potential redemptions would result in the new company
exceeding a certain leverage ratio or the new company losing
investment grade status or if the new company cannot
otherwise fund such redemptions, we are committed to fund
up to $2.875 billion in cash or common stock for each of the
two potential redemptions (for an aggregate of up to $5.75
billion), with amounts not used in the first redemption to be
available for the second redemption.
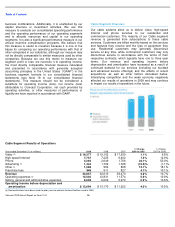
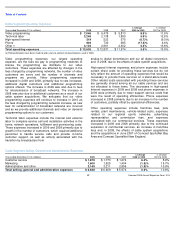
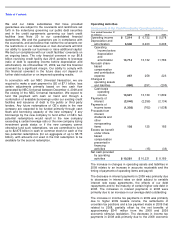
Operating Activities
Components of Net Cash Provided by Operating Activities
The increase in changes in operating assets and liabilities in
2009 relates to an increase in accounts receivable and the
timing of payments of operating items and payroll.
The decrease in interest payments in 2009 was primarily due
to decreases in interest rates on debt subject to variable
interest rate swap agreements, the effects of our debt
repayments and to the maturity of certain higher rate debt in
2008. The increases in interest payments in 2008 were
primarily due to an increase in our average debt outstanding.
The increase in income tax payments in 2009 was primarily
due to higher 2009 taxable income, the settlements of
uncertain tax positions and a tax payment made in 2009 that
related to 2008, partially offset by the net benefits of
approximately $341 million from the 2008 and 2009
economic stimulus legislation. The decrease in income tax
payments in 2008 was primarily due to the 2008 economic
Year ended December 31
(in millions)
2009
2008
2007
Operating income
$
7,214
$
6,732
$
5,578
Depreciation and
amortization
6,500
6,400
6,208
Operating
income before
depreciation
and
amortization
13,714
13,132
11,786
Noncash share-
based
compensation
and contribution
expense
257
258
223
Changes in
operating assets
and liabilities
(450
)
(251
)
(200
)
Cash basis
operating
income
13,521
13,139
11,809
Payments of
interest
(2,040
)
(2,256
)
(2,134
)
Payments of
income taxes
(1,303
)
(762
)
(1,638
)
Proceeds from
interest,
dividends and
other
nonoperating
items
103
125
185
Excess tax benefit
under share-
based
compensation
presented in
financing
activities
—
(
15
)
(33
)
Net cash provided
by operating
activities
$
10,281
$
10,231
$
8,189