Comcast 2009 Annual Report Download - page 29
Download and view the complete annual report
Please find page 29 of the 2009 Comcast annual report below. You can navigate through the pages in the report by either clicking on the pages listed below, or by using the keyword search tool below to find specific information within the annual report.-
 1
1 -
2
-
3
-
4
-
5
-
6
-
7
-
8
-
9
-
10
-
11
-
12
-
13
-
14
-
15
-
16
-
17
-
18
-
 19
19 -
 20
20 -
 21
21 -
 22
22 -
 23
23 -
 24
24 -
 25
25 -
 26
26 -
 27
27 -
 28
28 -
 29
29 -
 30
30 -
 31
31 -
 32
32 -
 33
33 -
 34
34 -
 35
35 -
 36
36 -
 37
37 -
 38
38 -
 39
39 -
40
-
41
-
42
-
43
-
44
-
45
-
46
-
47
-
48
-
49
-
50
-
51
-
52
-
53
-
54
-
55
-
56
-
57
-
58
-
59
-
60
-
61
-
62
-
63
-
64
-
65
-
66
-
67
-
68
-
69
-
70
-
71
-
72
-
73
-
74
-
75
-
76
-
77
-
78
-
79
-
80
-
81
-
82
-
83
-
84
-
85
-
86
-
87
-
88
-
89
-
90
-
91
-
92
-
93
-
94
-
95
-
96
-
97
-
98
-
99
-
100
-
101
-
102
-
103
-
104
-
105
-
106
-
107
-
108
-
109
-
110
-
111
-
112
-
113
-
114
-
115
-
116
-
117
-
118
-
119
-
120
-
121
-
122
-
123
-
124
-
125
-
126
-
127
-
128
-
129
-
130
-
131
-
132
-
133
-
134
-
135
-
136
-
137
-
138
-
139
-
140
-
141
-
142
-
143
-
144
-
145
-
146
-
147
-
148
-
149
-
150
-
151
-
152
-
153
-
154
-
155
-
156
-
157
-
158
-
159
-
160
-
161
-
162
-
163
-
164
-
165
-
166
-
167
-
168
-
169
-
170
-
171
-
172
-
173
-
174
-
175
-
176
-
177
-
178
-
179
-
180
-
181
-
182
-
183
-
184
-
185
-
186
-
187
-
188
-
189
-
190
-
191
-
192
-
193
-
194
-
195
-
196
-
197
-
198
-
199
-
200
-
201
-
202
-
203
-
204
-
205
-
206
-
207
-
208
-
209
-
210
-
211
-
212
-
213
-
214
-
215
-
216
-
217
-
218
-
219
-
220
-
221
-
222
-
223
-
224
-
225
-
226
-
227
-
228
-
229
-
230
-
231
 |
 |
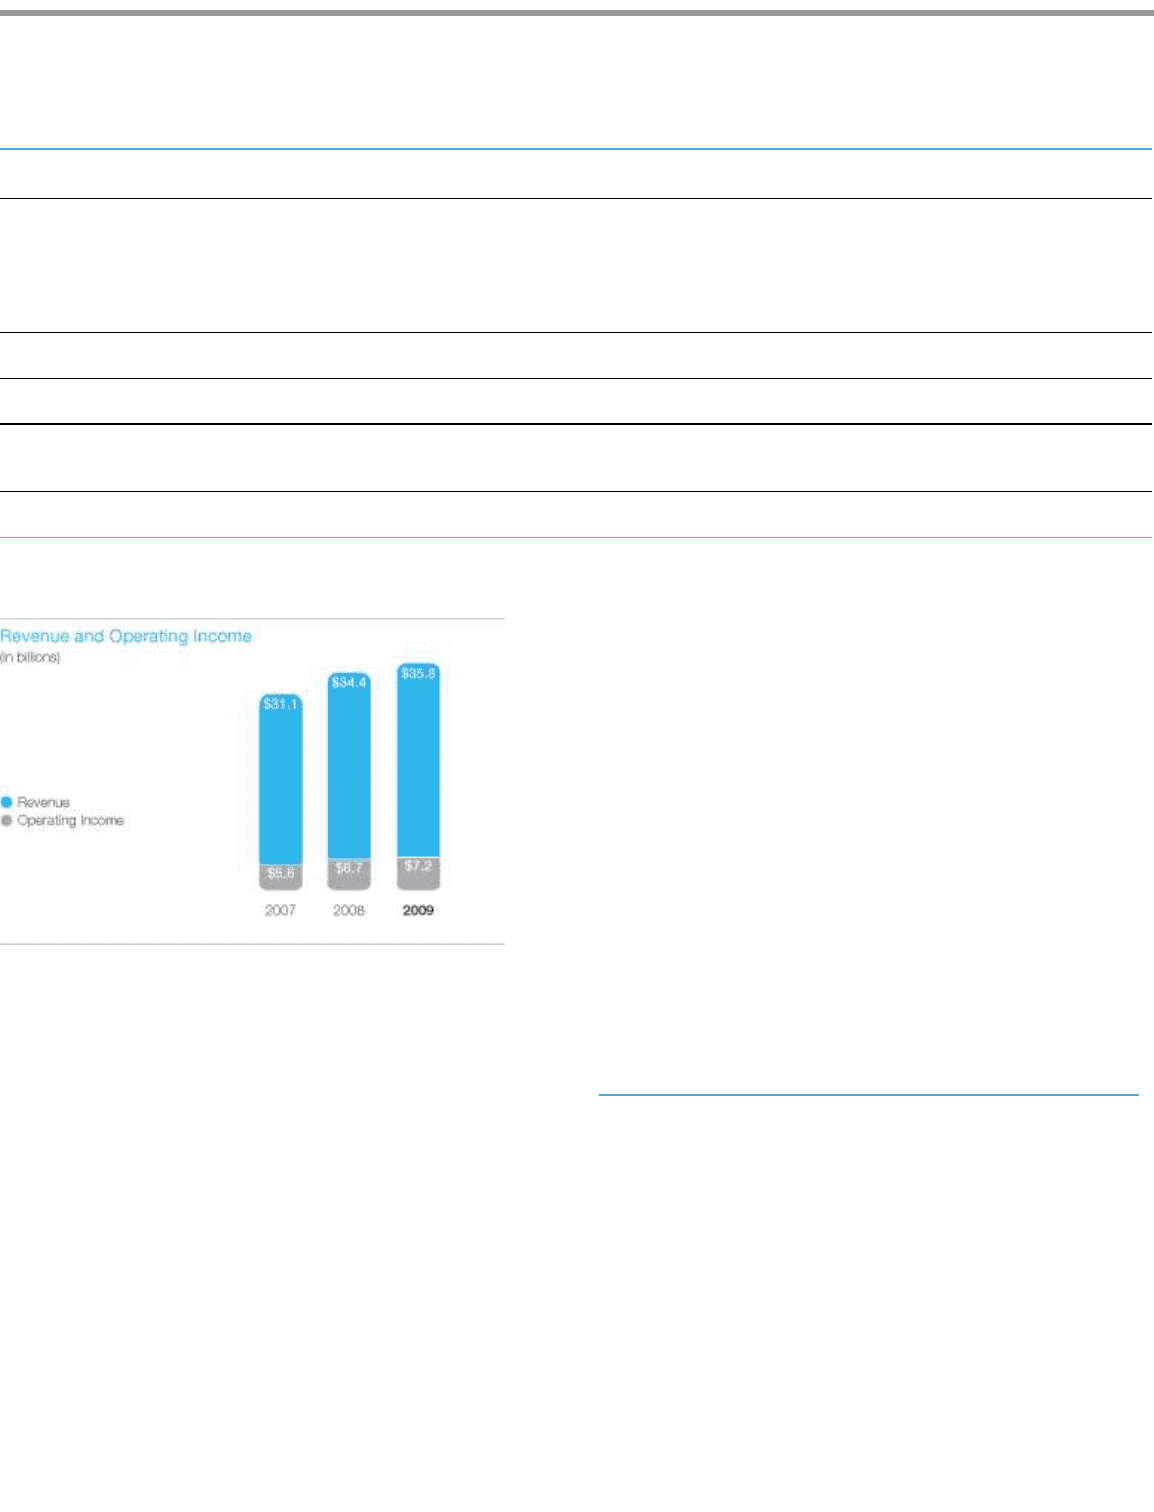
Table of Contents
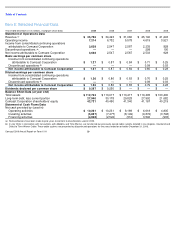
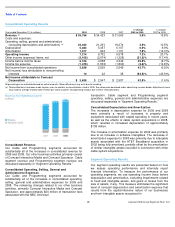
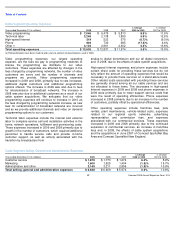
Consolidated Operating Results
All percentages are calculated based on actual amounts. Minor differences may exist due to rounding.
Year ended December 31 (in millions)
2009
2008
2007
% Change
2008 to 2009
% Change
2007 to 2008
Revenue
$
35,756
$
34,423
$
31,060
3.9
%
10.8
%
Costs and expenses:
Operating, selling, general and administrative
(excluding depreciation and amortization)
22,042
21,291
19,274
3.5
%
10.5
%
Depreciation
5,483
5,457
5,107
0.5
%
6.9
%
Amortization
1,017
943
1,101
7.8
%
(14.3
)%
Operating income
7,214
6,732
5,578
7.2
%
20.7
%
Other income (expense) items, net
(2,108
)
(2,674
)
(1,229
)
(21.2
)%
117.4
%
Income before income taxes
5,106
4,058
4,349
25.8
%
(6.7
)%
Income tax expense
(1,478
)
(1,533
)
(1,800
)
(3.6
)%
(14.8
)%
Net income from consolidated operations
3,628
2,525
2,549
43.7
%
(0.9
)%
Net (income) loss attributable to noncontrolling
interests
10
22
38
(54.5
)%
(43.9
)%
Net income attributable to Comcast
Corporation
$
3,638
$
2,547
$
2,587
42.8
%
(1.6
)%
(a)
Reclassifications have been made to prior years to conform to classifications used in 2009. See discussion described under advertising revenue below. Adjustments were
also made to average monthly total revenue per video customer and operating margins due to these reclassifications.
23
Comcast 2009 Annual Report on Form 10-
K
(a)
(a)
Consolidated Revenue
Our Cable and Programming segments accounted for
substantially all of the increases in consolidated revenue for
2009 and 2008. Our other business activities primarily consist
of Comcast Interactive Media and Comcast Spectacor. Cable
segment revenue and Programming segment revenue are
discussed separately in “Segment Operating Results.”
Consolidated Operating, Selling, General and
Administrative Expenses
Our Cable and Programming segments accounted for
substantially all of the increases in consolidated operating,
selling, general and administrative expenses for 2009 and
2008. The remaining changes related to our other business
activities, primarily Comcast Interactive Media and Comcast
Spectacor, and approximately $20 million of transaction fees
associated with the NBC Universal
transaction. Cable segment and Programming segment
operating, selling, general and administrative expenses are
discussed separately in “Segment Operating Results.”
Consolidated Depreciation and Amortization
The increases in depreciation expense for 2009 and 2008
were primarily a result of increases in property and
equipment associated with capital spending in recent years,
as well as the effects of cable system acquisitions in 2008,
which resulted in increased depreciation of approximately
$138 million.
The increase in amortization expense for 2009 was primarily
due to an increase in software intangibles. The decrease in
amortization expense for 2008 was primarily due to intangible
assets associated with the AT&T Broadband acquisition in
2002 being fully amortized, partially offset by the amortization
of similar intangible assets recorded in connection with other
cable system acquisitions.
Segment Operating Results
Our segment operating results are presented based on how
we assess operating performance and internally report
financial information. To measure the performance of our
operating segments, we use operating income (loss) before
depreciation and amortization, excluding impairments related
to fixed and intangible assets, and gains or losses from the
sale of assets, if any. This measure eliminates the significant
level of noncash depreciation and amortization expense that
results from the capital-intensive nature of our businesses
and from intangible assets recognized in