Comcast 2009 Annual Report Download - page 35
Download and view the complete annual report
Please find page 35 of the 2009 Comcast annual report below. You can navigate through the pages in the report by either clicking on the pages listed below, or by using the keyword search tool below to find specific information within the annual report.-
 1
1 -
2
-
3
-
4
-
5
-
6
-
7
-
8
-
9
-
10
-
11
-
12
-
13
-
14
-
15
-
16
-
17
-
18
-
19
-
20
-
21
-
22
-
23
-
24
-
 25
25 -
 26
26 -
 27
27 -
 28
28 -
 29
29 -
 30
30 -
 31
31 -
 32
32 -
 33
33 -
 34
34 -
 35
35 -
 36
36 -
 37
37 -
 38
38 -
 39
39 -
 40
40 -
 41
41 -
 42
42 -
 43
43 -
 44
44 -
 45
45 -
46
-
47
-
48
-
49
-
50
-
51
-
52
-
53
-
54
-
55
-
56
-
57
-
58
-
59
-
60
-
61
-
62
-
63
-
64
-
65
-
66
-
67
-
68
-
69
-
70
-
71
-
72
-
73
-
74
-
75
-
76
-
77
-
78
-
79
-
80
-
81
-
82
-
83
-
84
-
85
-
86
-
87
-
88
-
89
-
90
-
91
-
92
-
93
-
94
-
95
-
96
-
97
-
98
-
99
-
100
-
101
-
102
-
103
-
104
-
105
-
106
-
107
-
108
-
109
-
110
-
111
-
112
-
113
-
114
-
115
-
116
-
117
-
118
-
119
-
120
-
121
-
122
-
123
-
124
-
125
-
126
-
127
-
128
-
129
-
130
-
131
-
132
-
133
-
134
-
135
-
136
-
137
-
138
-
139
-
140
-
141
-
142
-
143
-
144
-
145
-
146
-
147
-
148
-
149
-
150
-
151
-
152
-
153
-
154
-
155
-
156
-
157
-
158
-
159
-
160
-
161
-
162
-
163
-
164
-
165
-
166
-
167
-
168
-
169
-
170
-
171
-
172
-
173
-
174
-
175
-
176
-
177
-
178
-
179
-
180
-
181
-
182
-
183
-
184
-
185
-
186
-
187
-
188
-
189
-
190
-
191
-
192
-
193
-
194
-
195
-
196
-
197
-
198
-
199
-
200
-
201
-
202
-
203
-
204
-
205
-
206
-
207
-
208
-
209
-
210
-
211
-
212
-
213
-
214
-
215
-
216
-
217
-
218
-
219
-
220
-
221
-
222
-
223
-
224
-
225
-
226
-
227
-
228
-
229
-
230
-
231
 |
 |

Table of Contents
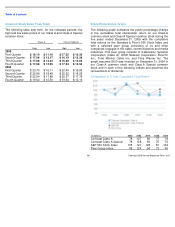
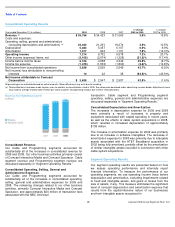
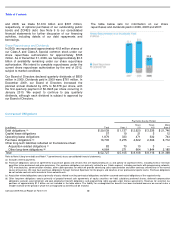
Consolidated Other Income (Expense) Items
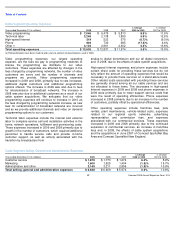
Interest Expense
During 2009, 2008 and 2007, interest expense included $175
million, $64 million and $2 million, respectively, of early
extinguishment losses, net of early extinguishment gains,
associated with the repayment of debt obligations prior to
their scheduled maturity. The decrease in interest expense
for 2009 was primarily due to the decrease in our average
debt outstanding and decreases in interest rates on our
variable rate debt and on debt subject to variable interest rate
swap agreements, partially offset by an increase in early
extinguishment costs in 2009. The increase in interest
expense for 2008 was primarily due to an increase in our
average debt outstanding and an increase in early
extinguishment costs in 2008, partially offset by the effects of
lower interest rates on our fixed to variable rate interest rate
exchange agreements.
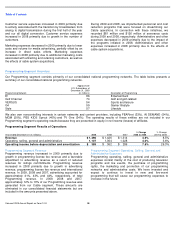
Investment Income (Loss), Net
The components of investment income (loss), net for 2009,
2008 and 2007 are presented in a table in Note 6 to our
consolidated financial statements. We have entered into
derivative financial instruments that we account for at fair
value and that economically hedge the market price
fluctuations in the common stock of all of our investments
accounted for as trading securities and substantially all of our
investments accounted for as available for sale securities.
The differences between the unrealized gains or losses on
securities underlying prepaid forward sale agreements and
the mark to market adjustments on the derivative component
of prepaid forward sale agreements, as presented in the table
in Note 6 to our consolidated financial statements, result from
one or more of the following:
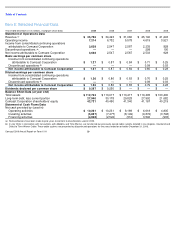
Year ended December 31
(in millions)
2009
2008
2007
Interest expense
$
(2,348
)
$
(2,439
)
$
(2,289
)
Investment income
(loss), net
282
89
601
Equity in net
(losses) income
of affiliates, net
(64
)
(39
)
(63
)
Other income
(expense)
22
(285
)
522
Total
$
(2,108
)
$
(2,674
)
$
(1,229
)
•
there were unusual changes in the derivative valuation
assumptions such as interest rates, volatility and dividend
policy
•
the magnitude of the difference between the market price
of the underlying security to which the derivative relates
and the strike price of the derivative
•
the change in the time value component of the derivative
value during the period
•
the security to which the derivative relates changed due to
a corporate reorganization of the issuing company to a
security with a different volatility rate
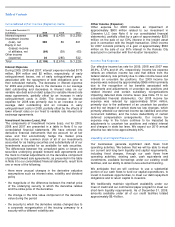
Other Income (Expense)
Other expense for 2008 includes an impairment of
approximately $600 million related to our investment in
Clearwire LLC (see Note 6 to our consolidated financial
statements), partially offset by a gain of approximately $235
million on the sale of our 50% interest in the Insight asset
pool in connection with the Insight transaction. Other income
for 2007 consists primarily of a gain of approximately $500
million on the sale of our 50% interest in the Kansas City
asset pool in connection with the Houston transaction.
Income Tax Expense
Our effective income tax rate for 2009, 2008 and 2007 was
28.9%, 37.8% and 41.4%, respectively. Income tax expense
reflects an effective income tax rate that differs from the
federal statutory rate primarily due to state income taxes and
interest on uncertain tax positions. Our 2009 income tax
expense was reduced by approximately $566 million primarily
due to the recognition of tax benefits associated with
settlements and adjustments of uncertain tax positions and
related interest and certain subsidiary reorganizations
impacting deferred state income taxes (see Note 15 to our
consolidated financial statements). Our 2008 income tax
expense was reduced by approximately $154 million,
primarily due to the settlement of an uncertain tax position
and the net impact of certain state tax law changes, which
primarily affected our deferred income tax liabilities and other
noncurrent liabilities, and the future deductibility of certain
deferred compensation arrangements. Our income tax
expense may in the future continue to be impacted by
adjustments to uncertain tax positions and related interest
and changes in state tax laws. We expect our 2010 annual
effective tax rate to be approximately 40%.
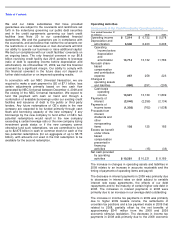
Liquidity and Capital Resources
Our businesses generate significant cash flows from
operating activities. We believe that we will be able to meet
our current and long-term liquidity and capital requirements,
including fixed charges, through our cash flows from
operating activities, existing cash, cash equivalents and
investments, available borrowings under our existing credit
facilities, and our ability to obtain future external financing.
We anticipate that we will continue to use a substantial
portion of our cash flows to fund our capital expenditures, to
invest in business opportunities, to meet our debt repayment
obligations and to return capital to investors.
We traditionally maintain significant availability under our
lines of credit and our commercial paper program to meet our
short-term liquidity requirements. As of December 31, 2009,
amounts available under all of our credit facilities totaled
approximately $6.4 billion.