Comcast 2009 Annual Report Download - page 27
Download and view the complete annual report
Please find page 27 of the 2009 Comcast annual report below. You can navigate through the pages in the report by either clicking on the pages listed below, or by using the keyword search tool below to find specific information within the annual report.-
 1
1 -
2
-
3
-
4
-
5
-
6
-
7
-
8
-
9
-
10
-
11
-
12
-
13
-
14
-
15
-
16
-
 17
17 -
 18
18 -
 19
19 -
 20
20 -
 21
21 -
 22
22 -
 23
23 -
 24
24 -
 25
25 -
 26
26 -
 27
27 -
 28
28 -
 29
29 -
 30
30 -
 31
31 -
 32
32 -
 33
33 -
 34
34 -
 35
35 -
 36
36 -
 37
37 -
38
-
39
-
40
-
41
-
42
-
43
-
44
-
45
-
46
-
47
-
48
-
49
-
50
-
51
-
52
-
53
-
54
-
55
-
56
-
57
-
58
-
59
-
60
-
61
-
62
-
63
-
64
-
65
-
66
-
67
-
68
-
69
-
70
-
71
-
72
-
73
-
74
-
75
-
76
-
77
-
78
-
79
-
80
-
81
-
82
-
83
-
84
-
85
-
86
-
87
-
88
-
89
-
90
-
91
-
92
-
93
-
94
-
95
-
96
-
97
-
98
-
99
-
100
-
101
-
102
-
103
-
104
-
105
-
106
-
107
-
108
-
109
-
110
-
111
-
112
-
113
-
114
-
115
-
116
-
117
-
118
-
119
-
120
-
121
-
122
-
123
-
124
-
125
-
126
-
127
-
128
-
129
-
130
-
131
-
132
-
133
-
134
-
135
-
136
-
137
-
138
-
139
-
140
-
141
-
142
-
143
-
144
-
145
-
146
-
147
-
148
-
149
-
150
-
151
-
152
-
153
-
154
-
155
-
156
-
157
-
158
-
159
-
160
-
161
-
162
-
163
-
164
-
165
-
166
-
167
-
168
-
169
-
170
-
171
-
172
-
173
-
174
-
175
-
176
-
177
-
178
-
179
-
180
-
181
-
182
-
183
-
184
-
185
-
186
-
187
-
188
-
189
-
190
-
191
-
192
-
193
-
194
-
195
-
196
-
197
-
198
-
199
-
200
-
201
-
202
-
203
-
204
-
205
-
206
-
207
-
208
-
209
-
210
-
211
-
212
-
213
-
214
-
215
-
216
-
217
-
218
-
219
-
220
-
221
-
222
-
223
-
224
-
225
-
226
-
227
-
228
-
229
-
230
-
231
 |
 |

Table of Contents
21
Comcast 2009 Annual Report on Form 10-
K
Item 7: Management’s Discussion and
Analysis of Financial Condition and Results
of Operations
Introduction and Overview
We are a leading provider of video, high-speed Internet and
phone services (“cable services”), offering a variety of
entertainment, information and communications services to
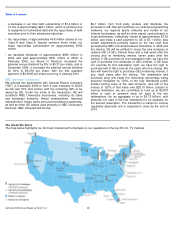
residential and commercial customers. As of December 31,
2009, our cable systems served approximately 23.6 million
video customers, 15.9 million high-speed Internet customers
and 7.6 million phone customers and passed over
51.2 million homes and businesses in 39 states and the
District of Columbia. We report the results of these
operations as our Cable segment, which generates
approximately 95% of our consolidated revenue. Our Cable
segment also includes the operations of our regional sports
networks. Our Programming segment consists primarily of
our consolidated national programming networks. During
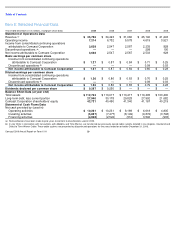
2009, our operations generated consolidated revenue of
approximately $ 35.8 billion.
Our Cable segment generates revenue primarily from
subscriptions to our cable services. In addition to cable
services, other Cable segment revenue sources include the
sale of advertising and the operation of our regional sports
networks. We market our cable services individually and in
packages. Our video services range from a limited analog
service to a full digital service with access to hundreds of
channels, including premium and pay-per-view channels On
Demand, music channels, and an interactive, on-screen
program guide. Digital video customers may also subscribe
to our advanced services, which consist of high-definition
television (“HDTV”) and/or digital video recorders (“DVR”).
Our high-speed Internet services provide Internet access at
downstream speeds of up to 50 Mbps, depending on the
service selected and subject to geographic market
availability. Our phone services provide local and long-
distance calling and other features. We also offer our cable
services to small and medium-sized businesses (“commercial
services”).
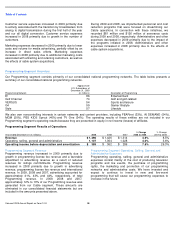
Our Programming segment consists primarily of our
consolidated national programming networks, E!, Golf
Channel, VERSUS, G4 and Style. Revenue from our
Programming segment is generated primarily from monthly
per subscriber license fees paid by multichannel video
providers, the sale of advertising and the licensing of our
programming internationally.
Our other business interests include Comcast Interactive
Media and Comcast Spectacor. Comcast Interactive Media
develops and operates our Internet businesses, including
Comcast.net, Fancast, thePlatform, Fandango, Plaxo and
DailyCandy. Revenue from Comcast Interactive Media is
generated primarily from the sale of advertising. Comcast
Spectacor owns two professional sports teams, the
Philadelphia 76ers and the Philadelphia Flyers, and a
large, multipurpose arena in Philadelphia, the Wachovia
Center, and provides facilities management services,
including food services, for sporting events, concerts and
other events. Comcast Interactive Media, Comcast Spectacor
and all other consolidated businesses not included in our
Cable or Programming segments are included in “Corporate
and Other” activities.
We operate our businesses in an intensely competitive
environment. Competition for the cable services we offer
consists primarily of direct broadcast satellite (“DBS”)
operators and phone companies. In 2009, our competitors
continued to add features and adopt aggressive pricing and
packaging for services that are comparable to the services
we offer. In addition, a substantial portion of our revenue
comes from residential customers whose spending patterns
may be affected by prevailing economic conditions.
Intensifying competition and the weak economy negatively
affected our results of operations in 2009 and may continue
to impact our results of operations in the future.
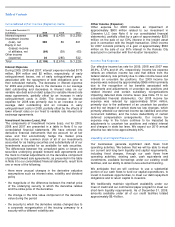
2009 Developments
The following are the more significant developments in our
businesses during 2009:
•
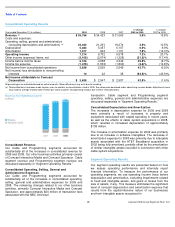
an increase in consolidated revenue of 3.9% to
approximately $35.8 billion and an increase in consolidated
operating income of 7.2% to approximately $7.2 billion
•
an increase in Cable segment revenue of 3.8% to
approximately $33.9 billion and an increase in operating
income before depreciation and amortization of 4.0% to
approximately $13.7 billion
•
an increase in Programming segment revenue of 4.9% to
approximately $1.5 billion and an increase in operating
income before depreciation and amortization of 7.5% to
approximately $389 million
•
the addition of approximately 1.0 million high-
speed
Internet customers and approximately 1.1 million phone
customers; a decrease of approximately 623,000 video
customers
•
a reduction in Cable segment capital expenditures of 9.2%
to approximately $5.0 billion
•
the continued investment in service enhancements,
including the transition from analog to digital transmission
of approximately 40 to 50 of the channels we distribute
(“our all digital conversion”),
which allows us to recapture
bandwidth and expand our video service offerings; the
continued deployment of DOCSIS 3.0 wideband
technology, which allows us to offer faster high-
speed
Internet service; the offering of certain cable network
programming to our customers online through Fancast
XFINITY TV; and the initial deployment of 4G wireless
high-speed Internet service in certain markets