Comcast 2009 Annual Report Download - page 31
Download and view the complete annual report
Please find page 31 of the 2009 Comcast annual report below. You can navigate through the pages in the report by either clicking on the pages listed below, or by using the keyword search tool below to find specific information within the annual report.-
 1
1 -
2
-
3
-
4
-
5
-
6
-
7
-
8
-
9
-
10
-
11
-
12
-
13
-
14
-
15
-
16
-
17
-
18
-
19
-
20
-
 21
21 -
 22
22 -
 23
23 -
 24
24 -
 25
25 -
 26
26 -
 27
27 -
 28
28 -
 29
29 -
 30
30 -
 31
31 -
 32
32 -
 33
33 -
 34
34 -
 35
35 -
 36
36 -
 37
37 -
 38
38 -
 39
39 -
 40
40 -
 41
41 -
42
-
43
-
44
-
45
-
46
-
47
-
48
-
49
-
50
-
51
-
52
-
53
-
54
-
55
-
56
-
57
-
58
-
59
-
60
-
61
-
62
-
63
-
64
-
65
-
66
-
67
-
68
-
69
-
70
-
71
-
72
-
73
-
74
-
75
-
76
-
77
-
78
-
79
-
80
-
81
-
82
-
83
-
84
-
85
-
86
-
87
-
88
-
89
-
90
-
91
-
92
-
93
-
94
-
95
-
96
-
97
-
98
-
99
-
100
-
101
-
102
-
103
-
104
-
105
-
106
-
107
-
108
-
109
-
110
-
111
-
112
-
113
-
114
-
115
-
116
-
117
-
118
-
119
-
120
-
121
-
122
-
123
-
124
-
125
-
126
-
127
-
128
-
129
-
130
-
131
-
132
-
133
-
134
-
135
-
136
-
137
-
138
-
139
-
140
-
141
-
142
-
143
-
144
-
145
-
146
-
147
-
148
-
149
-
150
-
151
-
152
-
153
-
154
-
155
-
156
-
157
-
158
-
159
-
160
-
161
-
162
-
163
-
164
-
165
-
166
-
167
-
168
-
169
-
170
-
171
-
172
-
173
-
174
-
175
-
176
-
177
-
178
-
179
-
180
-
181
-
182
-
183
-
184
-
185
-
186
-
187
-
188
-
189
-
190
-
191
-
192
-
193
-
194
-
195
-
196
-
197
-
198
-
199
-
200
-
201
-
202
-
203
-
204
-
205
-
206
-
207
-
208
-
209
-
210
-
211
-
212
-
213
-
214
-
215
-
216
-
217
-
218
-
219
-
220
-
221
-
222
-
223
-
224
-
225
-
226
-
227
-
228
-
229
-
230
-
231
 |
 |
Table of Contents
25
Comcast 2009 Annual Report on Form 10-
K
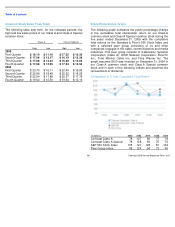
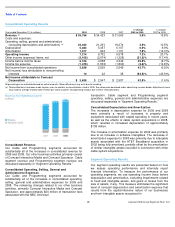
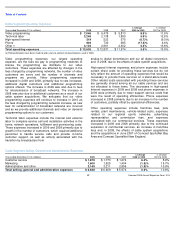
Cable Segment Revenue
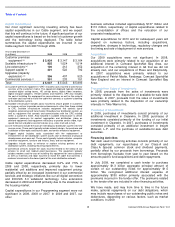
Our average monthly total revenue per video customer
increased to approximately $118 in 2009 from approximately
$111 in 2008 and approximately $102 in 2007. The increases
in average monthly total revenue per video customer are
primarily due to an increased number of customers receiving
multiple services and a higher contribution from our
commercial services business.
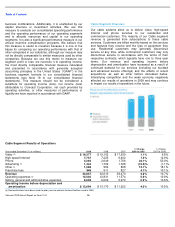
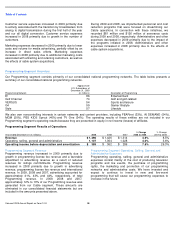
Video
We offer video services ranging from a limited analog service
to a full digital service with access to hundreds of channels,
including premium and pay-per-view channels. As of
December 31, 2009, approximately 46% of the homes in the
areas we serve subscribed to our video services. As of
December 31, 2009, approximately 78% of those video
customers subscribed to at least one of our digital video
services, compared to 70% and 63% as of December 31,
2008 and 2007, respectively. Digital video customers may
also subscribe to our advanced services, HDTV and/or DVR.
As of December 31, 2009, approximately 50% of our digital
video customers subscribed to at least one of our advanced
services.
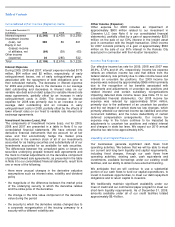
Our video revenue continued to grow in 2009 and 2008 due
to rate adjustments, customer upgrades to our digital and
advanced services and, in 2008, the effects of cable system
acquisitions, partially offset by declines in video customers in
each of 2009 and 2008. During 2009 and 2008, the number
of video customers decreased by approximately 623,000 and
575,000, respectively, excluding the effects of cable system
acquisitions in 2008. These decreases were primarily due to
increased competition in our service areas, as well as
weakness in the economy. During 2009 and 2008, we added
or upgraded approximately 1.4 million and 1.5 million
customers to our digital video service, respectively, including
those customers added or upgraded in connection with our
all digital conversion. We expect continued competition and
weak economic conditions to result in further declines in the
number of video customers during 2010. In 2008,
approximately $455 million of the increase in our video
revenue was attributable to the effects of cable system
acquisitions. Our average monthly
video revenue per video customer increased to
approximately $68 in 2009 from approximately $65 in 2008
and approximately $61 in 2007.
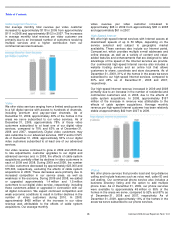
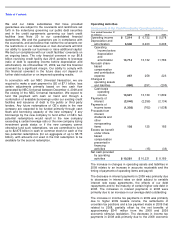
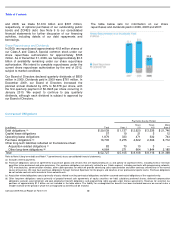
High-Speed Internet
We offer high-speed Internet services with Internet access at
downstream speeds of up to 50 Mbps, depending on the
service selected and subject to geographic market
availability. These services also include our Internet portal,
Comcast.net, which provides multiple e-mail addresses and
online storage, as well as a variety of content and value-
added features and enhancements that are designed to take
advantage of the speed of the Internet services we provide.
Our commercial high-speed Internet service also includes a
website hosting service and an online tool that allows
customers to share, coordinate and store documents. As of
December 31, 2009, 31% of the homes in the areas we serve
subscribed to our high-speed Internet services, compared to
30% and 28% as of December 31, 2008 and 2007,
respectively.
Our high-speed Internet revenue increased in 2009 and 2008
primarily due to an increase in the number of residential and
commercial customers and, in 2008, due to the effects of
cable system acquisitions. In 2008, approximately $157
million of the increase in revenue was attributable to the
effects of cable system acquisitions. Average monthly
revenue per high-speed Internet customer has been relatively
stable at approximately $42 from 2007 to 2009.
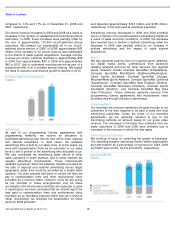
Phone
We offer phone services that provide local and long-distance
calling and include features such as voice mail, caller ID and
call waiting. Our commercial phone service also includes a
business directory listing and the option to add multiple
phone lines. As of December 31, 2009, our phone services
were available to approximately 48 million or 95% of the
homes in the areas we serve, compared to 92% and 87% as
of December 31, 2008 and 2007, respectively. As of
December 31, 2009, approximately 16% of the homes in the
areas we serve subscribed to our phone services,