Comcast 2009 Annual Report Download - page 32
Download and view the complete annual report
Please find page 32 of the 2009 Comcast annual report below. You can navigate through the pages in the report by either clicking on the pages listed below, or by using the keyword search tool below to find specific information within the annual report.-
 1
1 -
2
-
3
-
4
-
5
-
6
-
7
-
8
-
9
-
10
-
11
-
12
-
13
-
14
-
15
-
16
-
17
-
18
-
19
-
20
-
21
-
 22
22 -
 23
23 -
 24
24 -
 25
25 -
 26
26 -
 27
27 -
 28
28 -
 29
29 -
 30
30 -
 31
31 -
 32
32 -
 33
33 -
 34
34 -
 35
35 -
 36
36 -
 37
37 -
 38
38 -
 39
39 -
 40
40 -
 41
41 -
 42
42 -
43
-
44
-
45
-
46
-
47
-
48
-
49
-
50
-
51
-
52
-
53
-
54
-
55
-
56
-
57
-
58
-
59
-
60
-
61
-
62
-
63
-
64
-
65
-
66
-
67
-
68
-
69
-
70
-
71
-
72
-
73
-
74
-
75
-
76
-
77
-
78
-
79
-
80
-
81
-
82
-
83
-
84
-
85
-
86
-
87
-
88
-
89
-
90
-
91
-
92
-
93
-
94
-
95
-
96
-
97
-
98
-
99
-
100
-
101
-
102
-
103
-
104
-
105
-
106
-
107
-
108
-
109
-
110
-
111
-
112
-
113
-
114
-
115
-
116
-
117
-
118
-
119
-
120
-
121
-
122
-
123
-
124
-
125
-
126
-
127
-
128
-
129
-
130
-
131
-
132
-
133
-
134
-
135
-
136
-
137
-
138
-
139
-
140
-
141
-
142
-
143
-
144
-
145
-
146
-
147
-
148
-
149
-
150
-
151
-
152
-
153
-
154
-
155
-
156
-
157
-
158
-
159
-
160
-
161
-
162
-
163
-
164
-
165
-
166
-
167
-
168
-
169
-
170
-
171
-
172
-
173
-
174
-
175
-
176
-
177
-
178
-
179
-
180
-
181
-
182
-
183
-
184
-
185
-
186
-
187
-
188
-
189
-
190
-
191
-
192
-
193
-
194
-
195
-
196
-
197
-
198
-
199
-
200
-
201
-
202
-
203
-
204
-
205
-
206
-
207
-
208
-
209
-
210
-
211
-
212
-
213
-
214
-
215
-
216
-
217
-
218
-
219
-
220
-
221
-
222
-
223
-
224
-
225
-
226
-
227
-
228
-
229
-
230
-
231
 |
 |
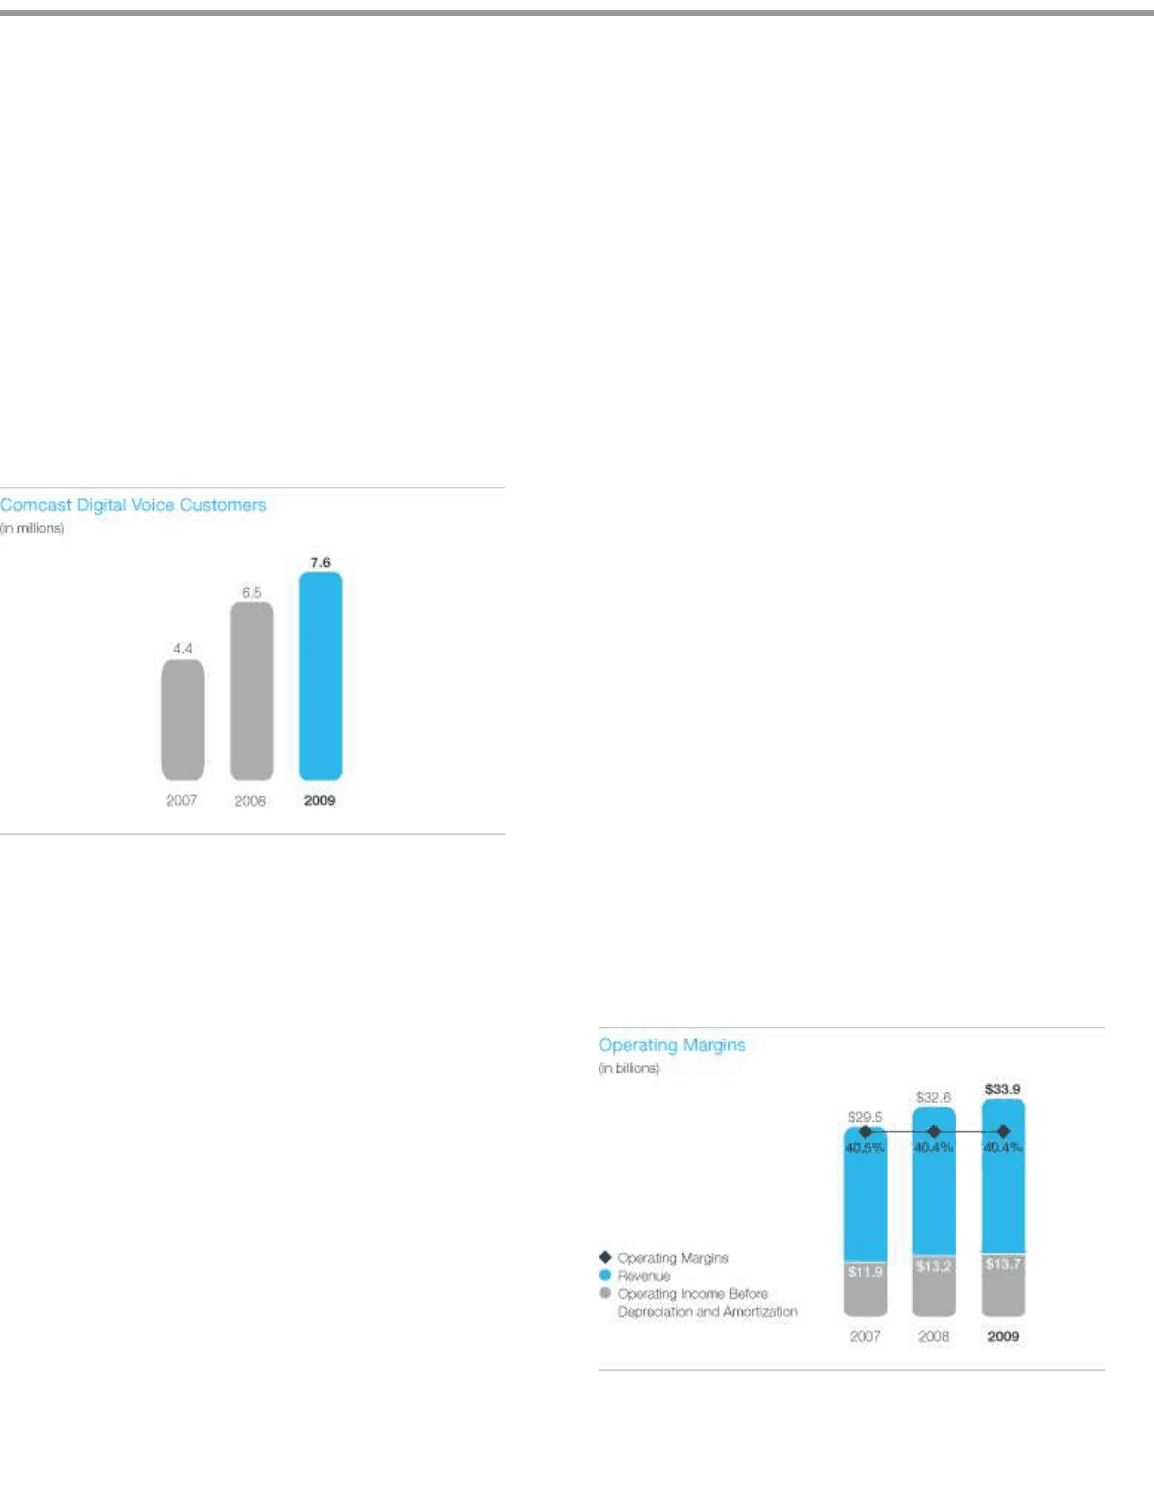
Table of Contents
Comcast 2009 Annual Report on Form 10-K
26
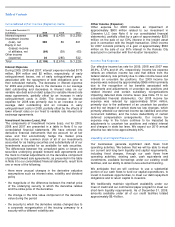
compared to 14% and 11% as of December 31, 2008 and
2007, respectively.
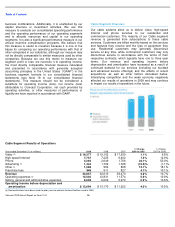
Our phone revenue increased in 2009 and 2008 as a result of
increases in the number of residential and commercial phone
customers. In 2008, these increases were partially offset by
the loss of approximately 170,000 circuit-switched phone
customers. We phased out substantially all of our circuit-
switched phone service in 2008. In 2008, approximately $43
million of the increase in our phone revenue was attributable
to the effects of cable system acquisitions. Average monthly
revenue per phone customer declined to approximately $39
in 2009 from approximately $40 in 2008 and approximately
$42 in 2007, due to customers receiving service as part of a
promotional offer or in a bundled service offering. We expect
the rates of customer and revenue growth to decline in 2010.
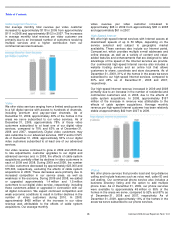
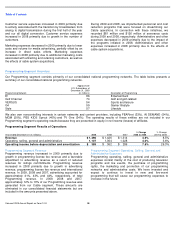
Advertising
As part of our programming license agreements with
programming networks, we receive an allocation of
scheduled advertising time that we may sell to local, regional
and national advertisers. In most cases, the available
advertising time is sold by our sales force. In some cases, we
work with representation firms as an extension of our sales
force to sell a portion of the advertising time allocated to us.
We also coordinate the advertising sales efforts of other
cable operators in some markets, and in some markets we
operate advertising interconnects. These interconnects
establish a physical, direct link between multiple providers for
the sale of regional and national advertising across larger
geographic areas than could be provided by a single cable
operator. Our prior practice had been to record the fees we
pay to representation firms and other multichannel video
providers as a revenue offset. However, since we are acting
as the principal in these arrangements and as these
coordination and interconnect activities are expected to grow
in significance, we have concluded that we should report the
fees paid to representation firms and multichannel video
providers as an operating expense rather than as a revenue
offset. Accordingly, we changed the presentation for these
items for 2008 and 2007,
and classified approximately $167 million and $165 million,
respectively, of the fees paid as operating expenses.
Advertising revenue decreased in 2009 and 2008 primarily
due to a decline in the overall television advertising market as
a result of weak economic conditions. In 2009, the decrease
also resulted from a decline in political advertising, while the
decrease in 2008 was partially offset by an increase in
political advertising and the impact of cable system
acquisitions.
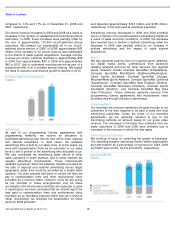
Other
We also generate revenue from our regional sports networks,
our digital media center, commissions from electronic
retailing networks and fees for other services. Our regional
sports networks include Comcast SportsNet (Philadelphia),
Comcast SportsNet Mid-Atlantic (Baltimore/Washington),
Cable Sports Southeast, Comcast SportsNet Chicago,
MountainWest Sports Network, Comcast SportsNet California
(Sacramento), Comcast SportsNet New England (Boston),
Comcast SportsNet Northwest (Portland), Comcast Sports
Southwest (Houston), and Comcast SportsNet Bay Area
(San Francisco). These networks generate revenue from
programming license agreements with multichannel video
providers and through the sale of advertising.
Franchise Fees
Our franchise fee revenue represents the pass-through to our
customers of the fees required to be paid to state and local
franchising authorities. Under the terms of our franchise
agreements, we are generally required to pay to the
franchising authority an amount based on our gross video
revenue. The increases in franchise fees collected from our
cable customers in 2009 and 2008 were primarily due to
increases in the revenue on which the fees apply.
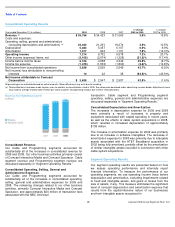
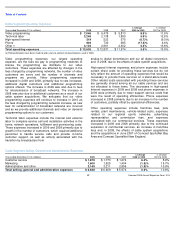
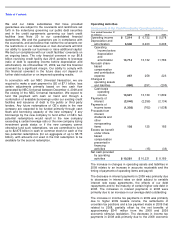
Cable Segment Expenses
We continue to focus on controlling the growth of expenses.
Our operating margins (operating income before depreciation
and amortization as a percentage of revenue) for 2009, 2008
and 2007 were 40.4%, 40.4% and 40.5%, respectively.