Comcast 2009 Annual Report Download - page 66
Download and view the complete annual report
Please find page 66 of the 2009 Comcast annual report below. You can navigate through the pages in the report by either clicking on the pages listed below, or by using the keyword search tool below to find specific information within the annual report.-
 1
1 -
2
-
3
-
4
-
5
-
6
-
7
-
8
-
9
-
10
-
11
-
12
-
13
-
14
-
15
-
16
-
17
-
18
-
19
-
20
-
21
-
22
-
23
-
24
-
25
-
26
-
27
-
28
-
29
-
30
-
31
-
32
-
33
-
34
-
35
-
36
-
37
-
38
-
39
-
40
-
41
-
42
-
43
-
44
-
45
-
46
-
47
-
48
-
49
-
50
-
51
-
52
-
53
-
54
-
55
-
 56
56 -
 57
57 -
 58
58 -
 59
59 -
 60
60 -
 61
61 -
 62
62 -
 63
63 -
 64
64 -
 65
65 -
 66
66 -
 67
67 -
 68
68 -
 69
69 -
 70
70 -
 71
71 -
 72
72 -
 73
73 -
 74
74 -
 75
75 -
 76
76 -
77
-
78
-
79
-
80
-
81
-
82
-
83
-
84
-
85
-
86
-
87
-
88
-
89
-
90
-
91
-
92
-
93
-
94
-
95
-
96
-
97
-
98
-
99
-
100
-
101
-
102
-
103
-
104
-
105
-
106
-
107
-
108
-
109
-
110
-
111
-
112
-
113
-
114
-
115
-
116
-
117
-
118
-
119
-
120
-
121
-
122
-
123
-
124
-
125
-
126
-
127
-
128
-
129
-
130
-
131
-
132
-
133
-
134
-
135
-
136
-
137
-
138
-
139
-
140
-
141
-
142
-
143
-
144
-
145
-
146
-
147
-
148
-
149
-
150
-
151
-
152
-
153
-
154
-
155
-
156
-
157
-
158
-
159
-
160
-
161
-
162
-
163
-
164
-
165
-
166
-
167
-
168
-
169
-
170
-
171
-
172
-
173
-
174
-
175
-
176
-
177
-
178
-
179
-
180
-
181
-
182
-
183
-
184
-
185
-
186
-
187
-
188
-
189
-
190
-
191
-
192
-
193
-
194
-
195
-
196
-
197
-
198
-
199
-
200
-
201
-
202
-
203
-
204
-
205
-
206
-
207
-
208
-
209
-
210
-
211
-
212
-
213
-
214
-
215
-
216
-
217
-
218
-
219
-
220
-
221
-
222
-
223
-
224
-
225
-
226
-
227
-
228
-
229
-
230
-
231
 |
 |

Table of Contents
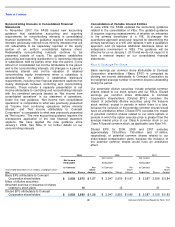
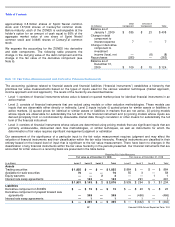
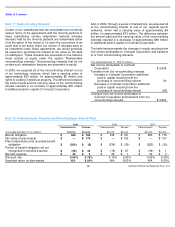
Note 10: Fair Value Measurements and Derivative Financial Instruments
The accounting guidance related to financial assets and financial liabilities (“financial instruments”)
establishes a hierarchy that
prioritizes fair value measurements based on the types of inputs used for the various valuation techniques (market approach,
income approach and cost approach). The levels of the hierarchy are described below:
Our assessment of the significance of a particular input to the fair value measurement requires judgment and may affect the
valuation of financial instruments and their classification within the fair value hierarchy. Financial instruments are classified in their
entirety based on the lowest level of input that is significant to the fair value measurement. There have been no changes in the
classification of any financial instruments within the fair value hierarchy in the periods presented. Our financial instruments that are
accounted for at fair value on a recurring basis are presented in the table below.
•
Level 1: consists of financial instruments whose value is based on quoted market prices for identical financial instruments in an
active market
•
Level 2: consists of financial instruments that are valued using models or other valuation methodologies. These models use
inputs that are observable either directly or indirectly; Level 2 inputs include (i) quoted prices for similar assets or liabilities in
active markets, (ii) quoted prices for identical or similar assets or liabilities in markets that are not active, (iii) pricing models
whose inputs are observable for substantially the full term of the financial instrument and (iv) pricing models whose inputs are
derived principally from or corroborated by observable market data through correlation or other means for substantially the full
term of the financial instrument
•
Level 3: consists of financial instruments whose values are determined using pricing models that use significant inputs that are
primarily unobservable, discounted cash flow methodologies, or similar techniques, as well as instruments for which the
determination of fair value requires significant management judgment or estimation
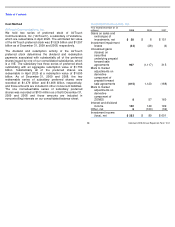
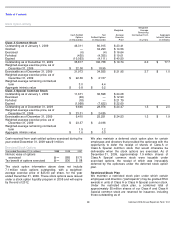
Recurring Fair Value Measures
Fair value as of December 31, 2009
Fair value as of December 31, 2008
(in millions)
Level 1
Level 2
Level 3
Total
Level 1
Level 2
Level 3
Total
Assets
Trading securities
$
1,855
$
—
$
—
$
1,855
$
884
$
—
$
—
$
884
Available
-
for
-
sale securities
76
—
—
76
55
3
—
58
Equity warrants
—
—
2
2
—
—
1
1
Interest rate swap agreements
—
143
—
143
—
291
—
291
$
1,931
$
143
$
2
$
2,076
$
939
$
294
$
1
$
1,234
Liabilities
Derivative component of ZONES
$
—
$
15
$
—
$
15
$
—
$
23
$
—
$
23
Derivative component of prepaid forward sale
agreements
—
349
—
349
—
(
466
)
—
(
466
)
Interest rate swap agreements
—
1
—
1
—
1
—
1
$
—
$
365
$
—
$
365
$
—
$
(
442
)
$
—
$
(
442
)
57
Comcast 2009 Annual Report on Form 10-
K
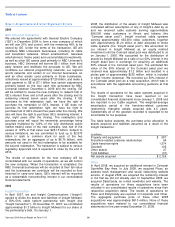
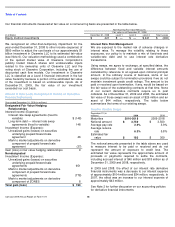
approximately 3.8 million shares of Sprint Nextel common
stock and 137,000 shares of CenturyTel common stock.
Before maturity, each of the ZONES is exchangeable at the
holder’s option for an amount of cash equal to 95% of the
aggregate market value of one share of Sprint Nextel
common stock and 0.0685 shares of CenturyTel common
stock.
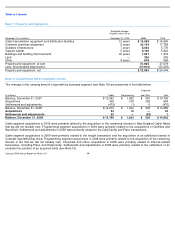
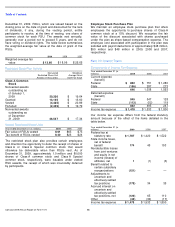
We separate the accounting for the ZONES into derivative
and debt components. The following table presents the
change in the carrying value of the debt component and the
change in the fair value of the derivative component (see
Note 6).
(in millions)
Debt
Component
Derivative
Component
Total
Balance as of
January 1, 2009
$
385
$
23
$
408
Change in debt
component to
interest expense
7
—
7
Change in derivative
component to
investment
income (loss), net
—
(
8
)
(8
)
Repurchases
(283
)
—
(
283
)
Balance as of
December 31,
2009
$
109
$
15
$
124