Comcast 2009 Annual Report Download - page 73
Download and view the complete annual report
Please find page 73 of the 2009 Comcast annual report below. You can navigate through the pages in the report by either clicking on the pages listed below, or by using the keyword search tool below to find specific information within the annual report.-
 1
1 -
2
-
3
-
4
-
5
-
6
-
7
-
8
-
9
-
10
-
11
-
12
-
13
-
14
-
15
-
16
-
17
-
18
-
19
-
20
-
21
-
22
-
23
-
24
-
25
-
26
-
27
-
28
-
29
-
30
-
31
-
32
-
33
-
34
-
35
-
36
-
37
-
38
-
39
-
40
-
41
-
42
-
43
-
44
-
45
-
46
-
47
-
48
-
49
-
50
-
51
-
52
-
53
-
54
-
55
-
56
-
57
-
58
-
59
-
60
-
61
-
62
-
 63
63 -
 64
64 -
 65
65 -
 66
66 -
 67
67 -
 68
68 -
 69
69 -
 70
70 -
 71
71 -
 72
72 -
 73
73 -
 74
74 -
 75
75 -
 76
76 -
 77
77 -
 78
78 -
 79
79 -
 80
80 -
 81
81 -
 82
82 -
 83
83 -
84
-
85
-
86
-
87
-
88
-
89
-
90
-
91
-
92
-
93
-
94
-
95
-
96
-
97
-
98
-
99
-
100
-
101
-
102
-
103
-
104
-
105
-
106
-
107
-
108
-
109
-
110
-
111
-
112
-
113
-
114
-
115
-
116
-
117
-
118
-
119
-
120
-
121
-
122
-
123
-
124
-
125
-
126
-
127
-
128
-
129
-
130
-
131
-
132
-
133
-
134
-
135
-
136
-
137
-
138
-
139
-
140
-
141
-
142
-
143
-
144
-
145
-
146
-
147
-
148
-
149
-
150
-
151
-
152
-
153
-
154
-
155
-
156
-
157
-
158
-
159
-
160
-
161
-
162
-
163
-
164
-
165
-
166
-
167
-
168
-
169
-
170
-
171
-
172
-
173
-
174
-
175
-
176
-
177
-
178
-
179
-
180
-
181
-
182
-
183
-
184
-
185
-
186
-
187
-
188
-
189
-
190
-
191
-
192
-
193
-
194
-
195
-
196
-
197
-
198
-
199
-
200
-
201
-
202
-
203
-
204
-
205
-
206
-
207
-
208
-
209
-
210
-
211
-
212
-
213
-
214
-
215
-
216
-
217
-
218
-
219
-
220
-
221
-
222
-
223
-
224
-
225
-
226
-
227
-
228
-
229
-
230
-
231
 |
 |

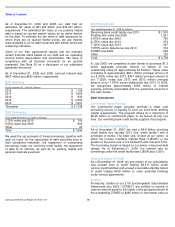
Table of Contents
Comcast 2009 Annual Report on Form 10-K
64
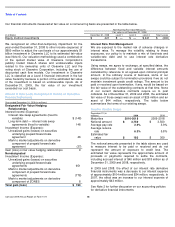
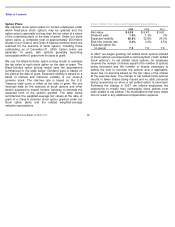
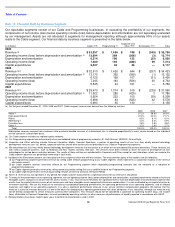
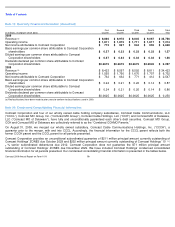
December 31, 2009. RSUs, which are valued based on the
closing price on the date of grant and discounted for the lack
of dividends, if any, during the vesting period, entitle
participants to receive, at the time of vesting, one share of
common stock for each RSU. The awards vest annually,
generally over a period not to exceed 5 years, and do not
have voting or dividend rights. The table below summarizes
the weighted-average fair value at the date of grant of the
RSUs.
Restricted Stock Plan Activity
Vested Restricted Share Units
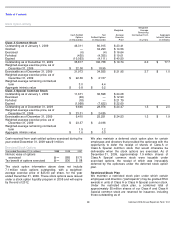
The restricted stock plan also provides certain employees
and directors the opportunity to defer the receipt of shares of
Class A or Class A Special common stock that would
otherwise be deliverable when their RSUs vest. As of
December 31, 2009, approximately 1.0 million and 80,000
shares of Class A common stock and Class A Special
common stock, respectively, were issuable under vested
RSU awards, the receipt of which was irrevocably deferred
by participants.
2009
2008
2007
Weighted-average fair
value
$
13.60
$
18.06
$
25.65
Nonvested
Restricted Share Unit
Awards (in thousands)
Weighted-
Average Grant
Date Fair Value
Class A Common
Stock
Nonvested awards
outstanding as
of January 1,
2009
20,336
$
19.64
Granted
13,125
$
13.60
Vested
(4,485
)
$
20.89
Forfeited
(2,439
)
$
19.79
Nonvested awards
outstanding as
of December
31, 2009
26,537
$
17.34
Year ended December 31 (in millions)
2009
2008
2007
Fair value of RSUs vested
$
61
$
65
$
75
Tax benefit of RSUs vested
$
22
$
23
$
24
Employee Stock Purchase Plan
We maintain an employee stock purchase plan that offers
employees the opportunity to purchase shares of Class A
common stock at a 15% discount. We recognize the fair
value of the discount associated with shares purchased
under the plan as share-based compensation expense. The
employee cost associated with participation in the plan was
satisfied with payroll deductions of approximately $48 million,
$50 million and $48 million in 2009, 2008 and 2007,
respectively.
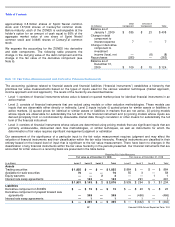
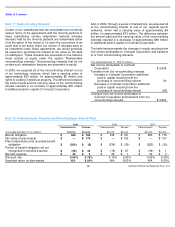
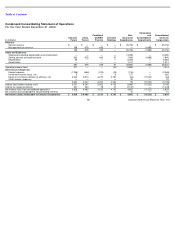
Note 15: Income Taxes
Components of Income Tax Expense
Our income tax expense differs from the federal statutory
amount because of the effect of the items detailed in the
table below.
Year ended December 31 (in
millions)
2009
2008
2007
Current expense
(benefit)
Federal
$
802
$
751
$
1,280
State
(156
)
287
273
646
1,038
1,553
Deferred expense
(benefit)
Federal
945
547
128
State
(113
)
(52
)
119
832
495
247
Income tax expense
$
1,478
$
1,533
$
1,800
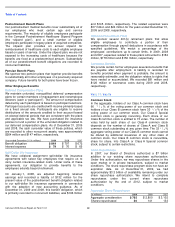
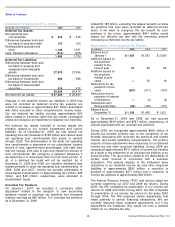
Year ended December 31 (in
millions)
2009
2008
2007
Federal tax at
statutory rate
$
1,787
$
1,420
$
1,522
State income taxes,
net of federal
benefit
174
45
153
Nondeductible losses
from joint ventures
and equity in net
income (losses) of
affiliates, net
1
(1
)
(3
)
Benefit related to
certain subsidiary
reorganizations
(151
)
—
—
Adjustments to
uncertain and
effectively settled
tax positions
(178
)
34
35
Accrued interest on
uncertain and
effectively settled
tax positions, net
(120
)
65
110
Other
(35
)
(30
)
(17
)
Income tax expense
$
1,478
$
1,533
$
1,800