Comcast 2009 Annual Report Download - page 60
Download and view the complete annual report
Please find page 60 of the 2009 Comcast annual report below. You can navigate through the pages in the report by either clicking on the pages listed below, or by using the keyword search tool below to find specific information within the annual report.-
 1
1 -
2
-
3
-
4
-
5
-
6
-
7
-
8
-
9
-
10
-
11
-
12
-
13
-
14
-
15
-
16
-
17
-
18
-
19
-
20
-
21
-
22
-
23
-
24
-
25
-
26
-
27
-
28
-
29
-
30
-
31
-
32
-
33
-
34
-
35
-
36
-
37
-
38
-
39
-
40
-
41
-
42
-
43
-
44
-
45
-
46
-
47
-
48
-
49
-
 50
50 -
 51
51 -
 52
52 -
 53
53 -
 54
54 -
 55
55 -
 56
56 -
 57
57 -
 58
58 -
 59
59 -
 60
60 -
 61
61 -
 62
62 -
 63
63 -
 64
64 -
 65
65 -
 66
66 -
 67
67 -
 68
68 -
 69
69 -
 70
70 -
71
-
72
-
73
-
74
-
75
-
76
-
77
-
78
-
79
-
80
-
81
-
82
-
83
-
84
-
85
-
86
-
87
-
88
-
89
-
90
-
91
-
92
-
93
-
94
-
95
-
96
-
97
-
98
-
99
-
100
-
101
-
102
-
103
-
104
-
105
-
106
-
107
-
108
-
109
-
110
-
111
-
112
-
113
-
114
-
115
-
116
-
117
-
118
-
119
-
120
-
121
-
122
-
123
-
124
-
125
-
126
-
127
-
128
-
129
-
130
-
131
-
132
-
133
-
134
-
135
-
136
-
137
-
138
-
139
-
140
-
141
-
142
-
143
-
144
-
145
-
146
-
147
-
148
-
149
-
150
-
151
-
152
-
153
-
154
-
155
-
156
-
157
-
158
-
159
-
160
-
161
-
162
-
163
-
164
-
165
-
166
-
167
-
168
-
169
-
170
-
171
-
172
-
173
-
174
-
175
-
176
-
177
-
178
-
179
-
180
-
181
-
182
-
183
-
184
-
185
-
186
-
187
-
188
-
189
-
190
-
191
-
192
-
193
-
194
-
195
-
196
-
197
-
198
-
199
-
200
-
201
-
202
-
203
-
204
-
205
-
206
-
207
-
208
-
209
-
210
-
211
-
212
-
213
-
214
-
215
-
216
-
217
-
218
-
219
-
220
-
221
-
222
-
223
-
224
-
225
-
226
-
227
-
228
-
229
-
230
-
231
 |
 |

Table of Contents
51
Comcast 2009 Annual Report on Form 10-
K
2007
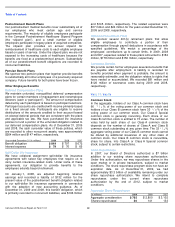
Houston Transaction
In July 2006, we initiated the dissolution of Texas and
Kansas City Cable Partners (the “Houston transaction”), our
50%-50% cable system partnership with Time Warner Cable
(“TWC”). On January 1, 2007, the distribution of assets by
Texas and Kansas City Cable Partners was completed and
we received the cable system serving Houston, Texas (the
“Houston asset pool”) and TWC received the cable systems
serving Kansas City, south and west Texas, and New Mexico
(the “Kansas City asset pool”). We accounted for the
distribution of assets by Texas and Kansas City Cable
Partners as a sale of our 50% interest in the Kansas City
asset pool in exchange for acquiring an additional 50%
interest in the Houston asset pool. This transaction resulted
in an increase of approximately 700,000 video customers.
The estimated fair value of the 50% interest of the Houston
asset pool we received was approximately $1.1 billion and
resulted in a pretax gain of approximately $500 million, which
is included in other income (expense). We recorded our 50%
interest in the Houston asset pool as a step acquisition,
which was in accordance with the applicable accounting
guidance at that time.
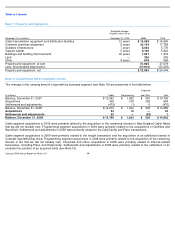
The results of operations for the cable systems acquired in
the Houston transaction have been reported in our Cable
segment since August 1, 2006 and in our consolidated
financial statements since January 1, 2007 (the date of the
distribution of assets). The weighted-average amortization
period of the franchise-related customer relationship
intangible assets acquired was 7 years. As a result of the
Houston transaction, we reversed deferred tax liabilities of
approximately $200 million, which were primarily related to
the excess of tax basis of the assets acquired over the tax
basis of the assets exchanged, and reduced the amount of
goodwill that would have otherwise been recorded in the
acquisition. Substantially all of the goodwill recorded is
expected to be amortizable for tax purposes.
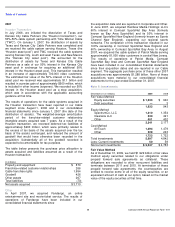
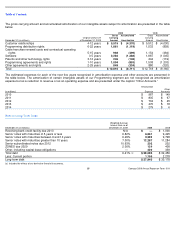
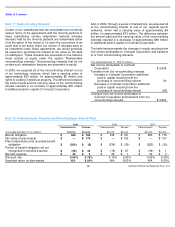
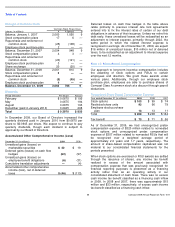
The table below presents the purchase price allocation to
assets acquired and liabilities assumed as a result of the
Houston transaction.
Other
In April 2007, we acquired Fandango, an online
entertainment site and movie-ticket service. The results of
operations of Fandango have been included in our
consolidated financial statements since
(in millions)
Property and equipment
$
870
Franchise
-
related customer relationships
266
Cable franchise rights
1,954
Goodwill
426
Other assets
267
Total liabilities
(73
)
Net assets acquired
$
3,710
the acquisition date and are reported in Corporate and Other.
In June 2007, we acquired Rainbow Media Holdings LLC’s
60% interest in Comcast SportsNet Bay Area (formerly
known as Bay Area SportsNet) and its 50% interest in
Comcast SportsNet New England (formerly known as Sports
Channel New England), expanding our regional sports
networks. The completion of this transaction resulted in our
100% ownership in Comcast SportsNet New England and
60% ownership in Comcast SportsNet Bay Area. In August
2007, we acquired the cable system of Patriot Media serving
approximately 81,000 video customers in central New Jersey.
The results of operations of Patriot Media, Comcast
SportsNet Bay Area and Comcast SportsNet New England
have been included in our consolidated financial statements
since their acquisition dates and are reported in our Cable
segment. The aggregate purchase price of these other 2007
acquisitions was approximately $1.288 billion. None of these
acquisitions were material to our consolidated financial
statements for the year ended December 31, 2007.
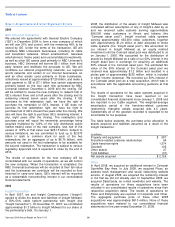
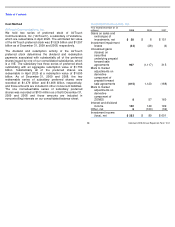
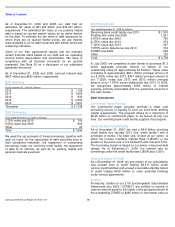
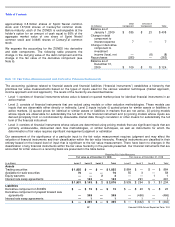
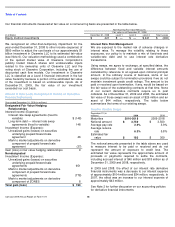
Note 6: Investments
Fair Value Method
As of December 31, 2009, we held $1.929 billion of fair value
method equity securities related to our obligations under
prepaid forward sale agreements as collateral. These
obligations are recorded to other noncurrent liabilities and
terminate between 2011 and 2015. At termination of these
prepaid forward sale agreements, the counterparties are
entitled to receive some or all of the equity securities, or an
equivalent amount of cash at our option, based on the market
value of the equity securities at that time.
December 31 (in millions)
2009
2008
Fair Value Method
Equity securities
$
1,933
$
940
Debt securities
—
3
1,933
943
Equity Method
SpectrumCo, LLC
1,410
1,354
Clearwire LLC
530
421
Other
401
402
2,341
2,177
Cost Method
AirTouch
1,494
1,479
Other
229
243
1,723
1,722
Total investments
5,997
4,842
Less: Current investments
50
59
Noncurrent investments
$
5,947
$
4,783