Comcast 2008 Annual Report Download - page 78
Download and view the complete annual report
Please find page 78 of the 2008 Comcast annual report below. You can navigate through the pages in the report by either clicking on the pages listed below, or by using the keyword search tool below to find specific information within the annual report.-
 1
1 -
2
-
3
-
4
-
5
-
6
-
7
-
8
-
9
-
10
-
11
-
12
-
13
-
14
-
15
-
16
-
17
-
18
-
19
-
20
-
21
-
22
-
23
-
24
-
25
-
26
-
27
-
28
-
29
-
30
-
31
-
32
-
33
-
34
-
35
-
36
-
37
-
38
-
39
-
40
-
41
-
42
-
43
-
44
-
45
-
46
-
47
-
48
-
49
-
50
-
51
-
52
-
53
-
54
-
55
-
56
-
57
-
58
-
59
-
60
-
61
-
62
-
63
-
64
-
65
-
66
-
67
-
 68
68 -
 69
69 -
 70
70 -
 71
71 -
 72
72 -
 73
73 -
 74
74 -
 75
75 -
 76
76 -
 77
77 -
 78
78 -
 79
79 -
 80
80 -
 81
81 -
 82
82 -
 83
83 -
 84
84 -
 85
85 -
 86
86 -
 87
87 -
 88
88 -
89
 |
 |

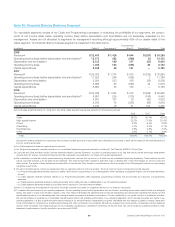
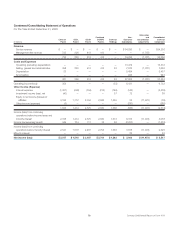
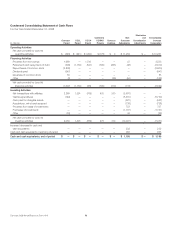
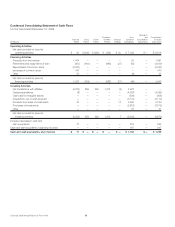
Condensed Consolidating Statement of Cash Flows
For the Year Ended December 31, 2008
(in millions)
Comcast
Parent
CCCL
Parent
CCCH
Parent
Combined
CCHMO
Parents
Comcast
Holdings
Non-
Guarantor
Subsidiaries
Elimination
and
Consolidation
Adjustments
Consolidated
Comcast
Corporation
Operating Activities
Net cash provided by (used in)
operating activities $ (446) $ (241) $ (200) $ (175) $ 9 $ 11,284 $ — $ 10,231
Financing Activities
Proceeds from borrowings 1,998 — 1,510 — — 27 — 3,535
Retirements and repayments of debt (308) (1,150) (541) (300) (263) (48) — (2,610)
Repurchases of common stock (2,800) — — — — — — (2,800)
Dividends paid (547) — — — — — — (547)
Issuances of common stock 53 — — — — — — 53
Other (3) — — — (56) (94) — (153)
Net cash provided by (used in)
financing activities (1,607) (1,150) 969 (300) (319) (115) — (2,522)
Investing Activities
Net transactions with affiliates 2,269 1,391 (769) 475 310 (3,676) — —
Capital expenditures (140) — — — — (5,610) — (5,750)
Cash paid for intangible assets — — — — — (527) — (527)
Acquisitions, net of cash acquired — — — — — (738) — (738)
Proceeds from sales of investments — — — — — 737 — 737
Purchases of investments — — — — — (1,167) — (1,167)
Other (76) — — — — 44 — (32)
Net cash provided by (used in)
investing activities 2,053 1,391 (769) 475 310 (10,937) — (7,477)
Increase (decrease) in cash and
cash equivalents — — — — — 232 — 232
Cash and cash equivalents, beginning of period — — — — — 963 — 963
Cash and cash equivalents, end of period $ — $ — $ — $ — $ — $ 1,195 $ — $ 1,195
Comcast 2008 Annual Report on Form 10-K 76