Comcast 2008 Annual Report Download - page 29
Download and view the complete annual report
Please find page 29 of the 2008 Comcast annual report below. You can navigate through the pages in the report by either clicking on the pages listed below, or by using the keyword search tool below to find specific information within the annual report.-
 1
1 -
2
-
3
-
4
-
5
-
6
-
7
-
8
-
9
-
10
-
11
-
12
-
13
-
14
-
15
-
16
-
17
-
18
-
 19
19 -
 20
20 -
 21
21 -
 22
22 -
 23
23 -
 24
24 -
 25
25 -
 26
26 -
 27
27 -
 28
28 -
 29
29 -
 30
30 -
 31
31 -
 32
32 -
 33
33 -
 34
34 -
 35
35 -
 36
36 -
 37
37 -
 38
38 -
 39
39 -
40
-
41
-
42
-
43
-
44
-
45
-
46
-
47
-
48
-
49
-
50
-
51
-
52
-
53
-
54
-
55
-
56
-
57
-
58
-
59
-
60
-
61
-
62
-
63
-
64
-
65
-
66
-
67
-
68
-
69
-
70
-
71
-
72
-
73
-
74
-
75
-
76
-
77
-
78
-
79
-
80
-
81
-
82
-
83
-
84
-
85
-
86
-
87
-
88
-
89
 |
 |
customer for our digital phone service has declined, to approx-
imately $39 in 2008 from approximately $42 in 2007 and
approximately $45 in 2006, due to customers receiving service as
part of a promotional offer or in a bundled service offering. We
expect the rates of customer and revenue growth to slow in 2009,
because we do not expect to launch any significant new service
areas in 2009 and due to weak economic conditions continuing.
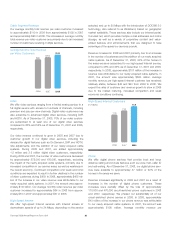
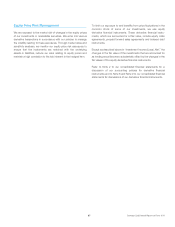
Comcast Digital Voice Customers
(in millions)
2008
2007
2006
1.9
4.4
6.5
Advertising
As part of our programming license agreements with programming
networks, we receive an allocation of scheduled advertising time
that we may sell to local, regional and national advertisers. We also
coordinate the advertising sales efforts of other cable operators in
some markets, and in some markets we operate advertising inter-
connects. These interconnects establish a physical, direct link
between multiple cable systems and provide for the sale of
regional and national advertising across larger geographic areas
than could be provided by a single cable operator.
Advertising revenue decreased in 2008 primarily due to a decline in
the television advertising market, including the automotive and
housing sectors, offset by an increase in political advertising and
the addition of the newly acquired cable systems. Advertising
revenue increased in 2007 as a result of our newly acquired cable
systems. Absent the growth from the newly acquired cable sys-
tems, advertising revenue decreased slightly in 2007, reflecting
weakness across the television advertising market, a lower level of
political advertising and one less week in the broadcast calendar
during 2007 compared to 2006. We expect our advertising rev-
enue to decline in 2009 due to a deteriorating advertising market,
less political advertising and weak economic conditions continuing.
Other
We also generate revenue from our regional sports networks, our
digital media center, on-screen guide advertising, commissions
from electronic retailing networks and fees for other services.
Our regional sports networks include Comcast SportsNet
(Philadelphia), Comcast SportsNet Mid-Atlantic (Baltimore/
Washington), Cable Sports Southeast, Comcast SportsNet
Chicago, Comcast SportsNet California (Sacramento), Comcast
SportsNet Northwest (Portland), Comcast SportsNet New England
(Boston), Comcast SportsNet Bay Area (San Francisco) and
MountainWest Sports Network. These networks generate revenue
through programming license agreements with multichannel video
providers and the sale of advertising time.
Other revenue increased in 2008 and 2007 as a result of our
acquisitions in June 2007 of Comcast SportsNet Bay Area and
Comcast SportsNet New England and our acquisitions of the
newly acquired cable systems.
Franchise Fees
Our franchise fee revenue represents the pass-through to our cus-
tomers of the fees required to be paid to state and local franchising
authorities. Under the terms of our franchise agreements, we are
generally required to pay to the franchising authority an amount
based on our gross video revenue. The increases in franchise fees
collected from our cable customers in 2008 and 2007 were primarily
due to increases in the revenue on which the fees apply.
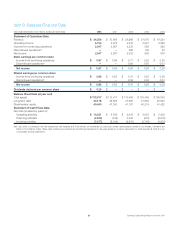
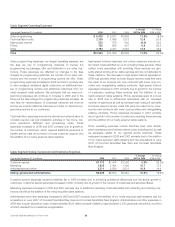
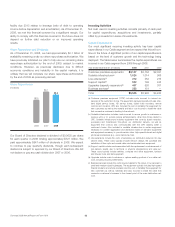
Cable Segment Expenses
We continue to focus on controlling the growth of expenses. Our
operating margins (operating income before depreciation and
amortization as a percentage of revenue) for 2008, 2007 and 2006
were 40.6 %, 40.7% and 40.2%, respectively.
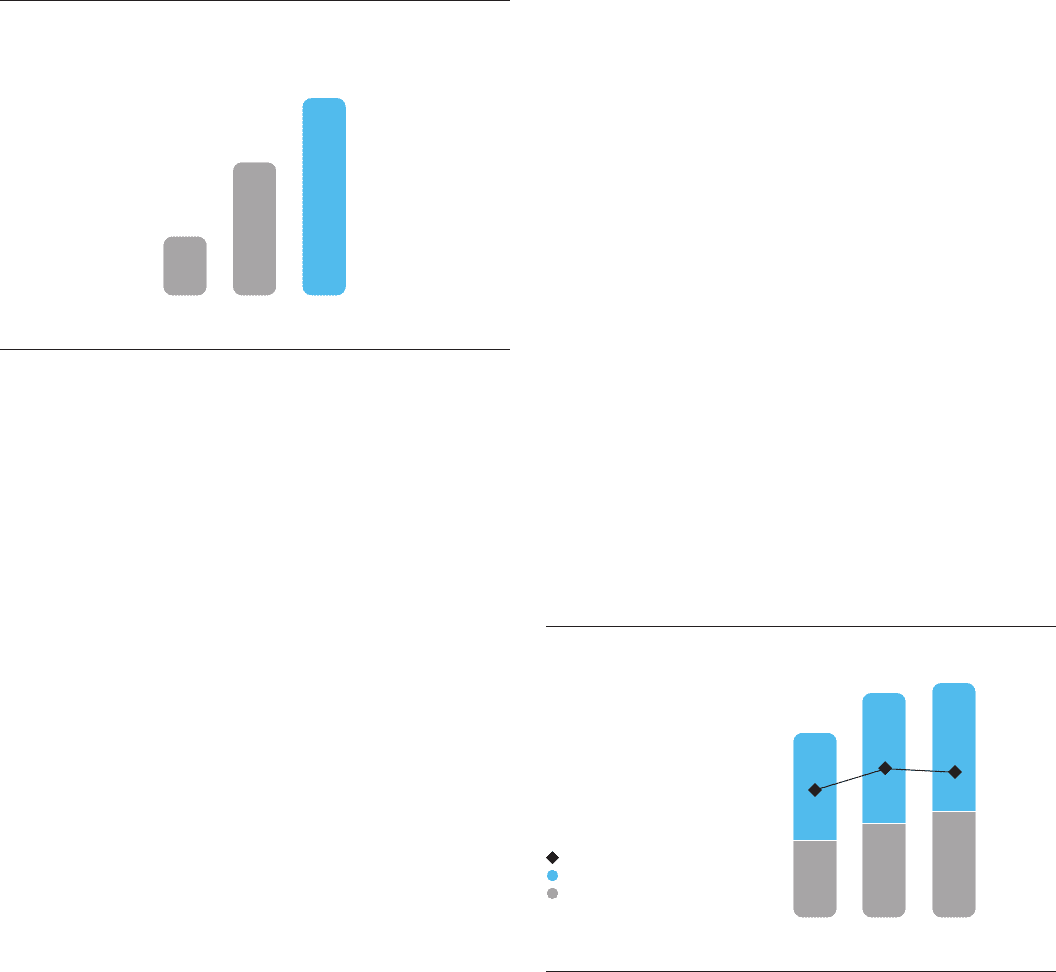
Operating Margins
(in billions)
20072006
$9.7
$11.9
$24.0
$29.3
40.2%
40.7%
Operating Margins
Revenue
Operating Income Before
Depreciation and Amortization
2008
$13.2
$32.4
40.6%
27 Comcast 2008 Annual Report on Form 10-K