Comcast 2008 Annual Report Download - page 27
Download and view the complete annual report
Please find page 27 of the 2008 Comcast annual report below. You can navigate through the pages in the report by either clicking on the pages listed below, or by using the keyword search tool below to find specific information within the annual report.-
 1
1 -
2
-
3
-
4
-
5
-
6
-
7
-
8
-
9
-
10
-
11
-
12
-
13
-
14
-
15
-
16
-
 17
17 -
 18
18 -
 19
19 -
 20
20 -
 21
21 -
 22
22 -
 23
23 -
 24
24 -
 25
25 -
 26
26 -
 27
27 -
 28
28 -
 29
29 -
 30
30 -
 31
31 -
 32
32 -
 33
33 -
 34
34 -
 35
35 -
 36
36 -
 37
37 -
38
-
39
-
40
-
41
-
42
-
43
-
44
-
45
-
46
-
47
-
48
-
49
-
50
-
51
-
52
-
53
-
54
-
55
-
56
-
57
-
58
-
59
-
60
-
61
-
62
-
63
-
64
-
65
-
66
-
67
-
68
-
69
-
70
-
71
-
72
-
73
-
74
-
75
-
76
-
77
-
78
-
79
-
80
-
81
-
82
-
83
-
84
-
85
-
86
-
87
-
88
-
89
 |
 |
Segment Operating Results
Our segment operating results are presented based on how we
assess operating performance and internally report financial
information. To measure the performance of our operating seg-
ments, we use operating income (loss) before depreciation and
amortization, excluding impairments related to fixed and intangible
assets, and gains or losses from the sale of assets, if any. This
measure eliminates the significant level of noncash depreciation
and amortization expense that results from the capital-intensive
nature of our businesses and from intangible assets recognized in
business combinations. Additionally, it is unaffected by our capital
structure or investment activities. We use this measure to evaluate
our consolidated operating performance and the operating per-
formance of our operating segments and to allocate resources and
capital to our operating segments. It is also a significant perform-
ance measure in our annual incentive compensation programs.
We believe that this measure is useful to investors because it is
one of the bases for comparing our operating performance with
that of other companies in our industries, although our measure
may not be directly comparable to similar measures used by other
companies. Because we use this metric to measure our segment
profit or loss, we reconcile it to operating income, the most directly
comparable financial measure calculated and presented in
accordance with generally accepted accounting principles in the
United States (“GAAP”) in the business segment footnote to our
consolidated financial statements (see Note 16 to our consolidated
financial statements). This measure should not be considered a
substitute for operating income (loss), net income (loss), net cash
provided by operating activities, or other measures of performance
or liquidity we have reported in accordance with GAAP.
Cable Segment Overview
Our cable systems simultaneously deliver video, high-speed Inter-
net and phone services to our customers. The majority of our
Cable segment revenue is generated from subscriptions to these
cable services. Customers are billed monthly, based on the serv-
ices and features they receive and the type of equipment they use.
While residential customers may discontinue service at any time,
business customers may only discontinue their service in accord-
ance with the terms of their respective contracts, which typically
have one to three year terms. Our revenue and operating income
before depreciation and amortization have increased as a result of
the effects of our recent acquisitions, continued demand for our
services (including our bundled and advanced service offerings), as
well as other factors discussed below.
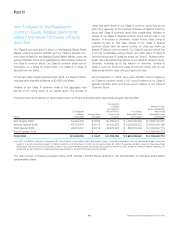
Of our total customers, in 2008 the newly acquired cable systems
accounted for 696,000 video customers, 370,000 high-speed
Internet customers and 74,000 phone customers. In 2007, they
accounted for 81,000 video customers, 58,000 high-speed Inter-
net customers and 16,000 phone customers. In 2006, they
accounted for 3.5 million video customers, 1.7 million high-speed
Internet customers and 173,000 phone customers. In 2008 and
2007, the newly acquired cable systems accounted for approx-
imately $742 million and $2.6 billion of the increases in revenue,
respectively. Intensifying competition and a weakening economy
affected our net customer additions in 2008 and may, if these
conditions continue, adversely impact our results of operations in
the future.
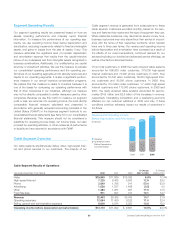
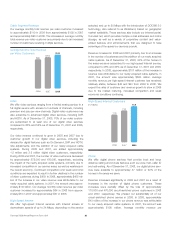
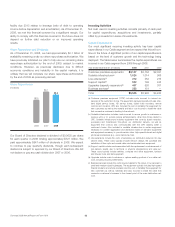
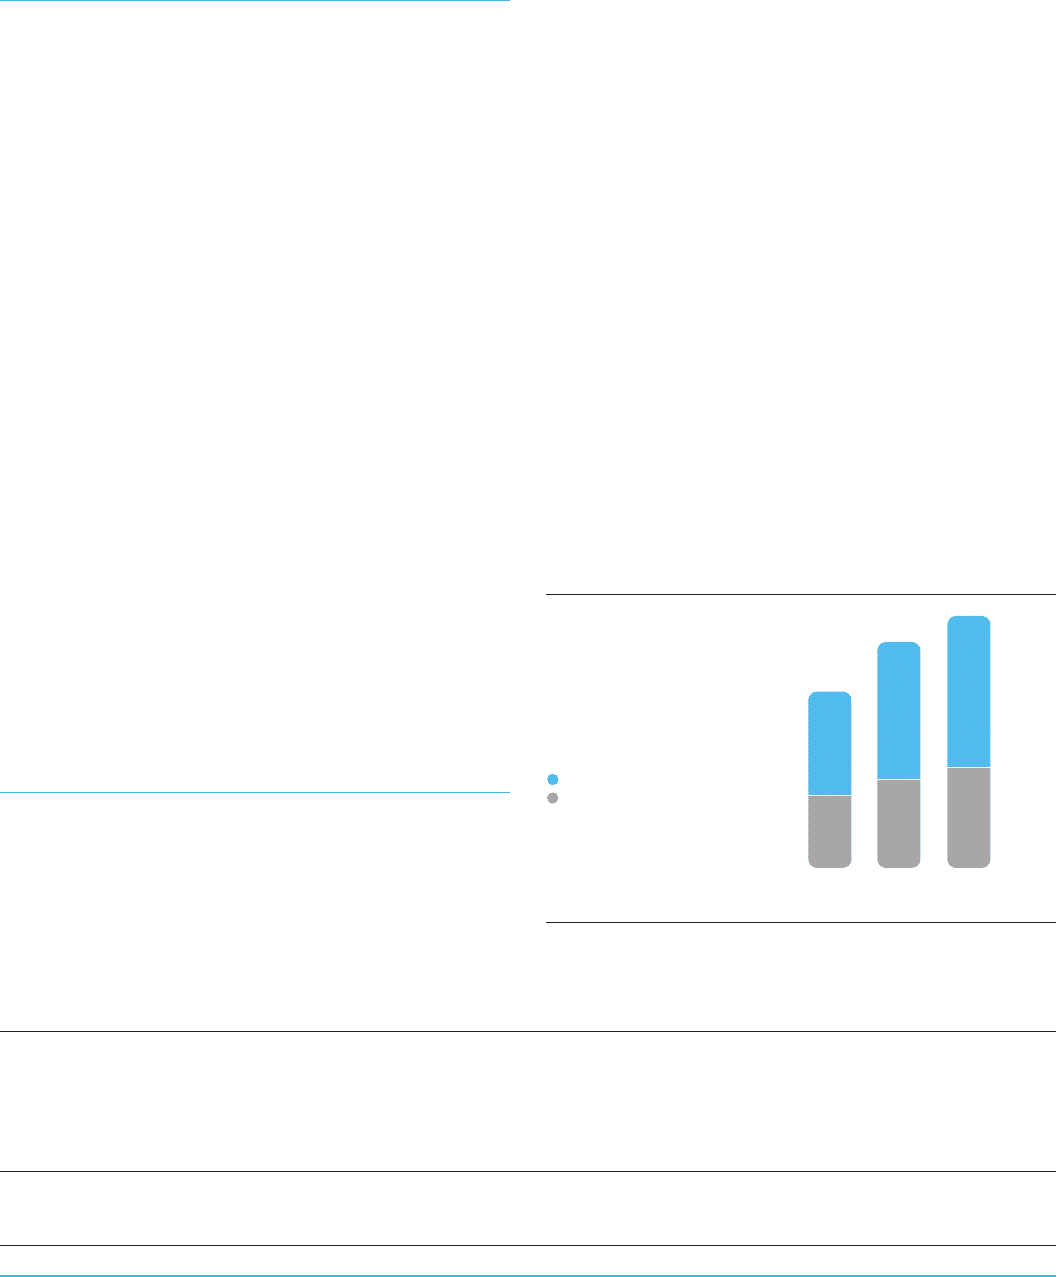
Revenue and Operating Income
Before Depreciation and Amortization
(in billions)
2007
2006
Revenue
Operating Income
Before Depreciation
and Amortization
$24.0
$29.3
$9.7
$11.9
2008
$32.4
$13.2
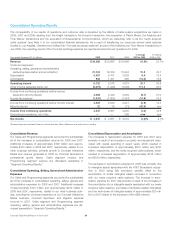
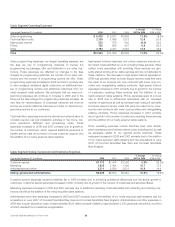
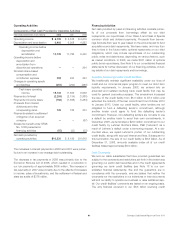
Cable Segment Results of Operations
Year ended December 31 (in millions) 2008 2007 2006
% Change
2007 to 2008
% Change
2006 to 2007
Video $18,849 $17,686 $15,062 6.6% 17.4%
High-speed Internet 7,225 6,402 4,953 12.9 29.2
Phone 2,649 1,766 911 50.0 93.9
Advertising 1,526 1,537 1,468 (0.5) 4.5
Other 1,283 1,087 927 17.6 17.5
Franchise fees 911 827 721 10.1 14.7
Revenue 32,443 29,305 24,042 10.7 21.9
Operating expenses 12,664 11,409 9,322 11.0 22.4
Selling, general and administrative expenses 6,609 5,974 5,053 10.6 18.2
Operating income before depreciation and amortization $13,170 $11,922 $ 9,667 10.5% 23.3%
25 Comcast 2008 Annual Report on Form 10-K