Comcast 2008 Annual Report Download - page 32
Download and view the complete annual report
Please find page 32 of the 2008 Comcast annual report below. You can navigate through the pages in the report by either clicking on the pages listed below, or by using the keyword search tool below to find specific information within the annual report.-
 1
1 -
2
-
3
-
4
-
5
-
6
-
7
-
8
-
9
-
10
-
11
-
12
-
13
-
14
-
15
-
16
-
17
-
18
-
19
-
20
-
21
-
 22
22 -
 23
23 -
 24
24 -
 25
25 -
 26
26 -
 27
27 -
 28
28 -
 29
29 -
 30
30 -
 31
31 -
 32
32 -
 33
33 -
 34
34 -
 35
35 -
 36
36 -
 37
37 -
 38
38 -
 39
39 -
 40
40 -
 41
41 -
 42
42 -
43
-
44
-
45
-
46
-
47
-
48
-
49
-
50
-
51
-
52
-
53
-
54
-
55
-
56
-
57
-
58
-
59
-
60
-
61
-
62
-
63
-
64
-
65
-
66
-
67
-
68
-
69
-
70
-
71
-
72
-
73
-
74
-
75
-
76
-
77
-
78
-
79
-
80
-
81
-
82
-
83
-
84
-
85
-
86
-
87
-
88
-
89
 |
 |

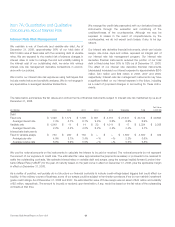
our investments accounted for as trading securities. The differ-
ences between the unrealized gains (losses) on trading securities
and the mark to market adjustments on derivatives related to trad-
ing securities, as presented in the table in Note 6 to our
consolidated financial statements, result from one or more of the
following:
• there were unusual changes in the derivative valuation assump-
tions such as interest rates, volatility and dividend policy
• the magnitude of the difference between the market price of the
underlying security to which the derivative relates and the strike
price of the derivative
• the change in the time value component of the derivative value
during the period
• the security to which the derivative relates changed due to a
corporate reorganization of the issuing company to a security
with a different volatility rate
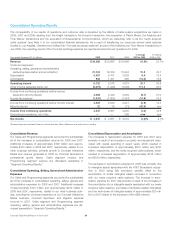
Other Income (Expense)
Other expense for 2008 includes an impairment of approximately
$600 million related to our investment in Clearwire (see Note 6 to
our consolidated financial statements), partially offset by a gain of
approximately $235 million on the sale of our 50% interest in the
Insight asset pool in connection with the Insight transaction. Other
income for 2007 consisted primarily of a gain of approximately
$500 million on the sale of our 50% interest in the Kansas City
asset pool in connection with the Houston transaction. Other
income for 2006 consisted primarily of $170 million of gains on the
sale of nonoperating assets, partially offset by a $59 million
impairment related to one of our equity method investments.
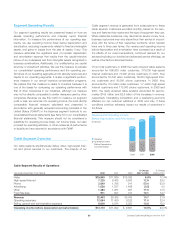
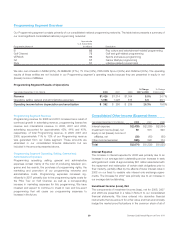
Income Tax Expense
Our effective income tax rate for 2008, 2007 and 2006 was
37.8%, 41.4% and 37.5%, respectively. Income tax expense
reflects an effective income tax rate that differs from the federal
statutory rate primarily due to state income taxes and interest on
uncertain tax positions. Our 2008 income tax expense was
reduced by approximately $154 million, $80 million of which is due
to the settlement of an uncertain tax position (see Note 13 to our
consolidated financial statements) and the net impact of certain
state tax law changes that primarily affected our deferred income
tax liabilities and other noncurrent liabilities, and the balance of
which is primarily due to the future deductibility of certain deferred
compensation arrangements. Our tax rate in 2006 was impacted
by adjustments to uncertain tax positions, which were primarily
due to the favorable resolution of issues and revised estimates of
the outcome of unresolved issues with various taxing authorities.
We expect our 2009 annual effective tax rate to be in the range of
40% to 45%.
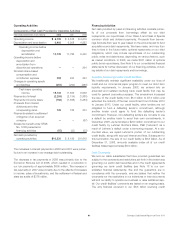
Discontinued Operations
The operating results of our previously owned cable systems
located in Los Angeles, Dallas and Cleveland, which were reported
as discontinued operations for 2006, included 7 months of oper-
ations in 2006 because the closing date of the transaction was
July 31, 2006. As a result of the exchange of these systems in the
Adelphia and Time Warner transactions, we recognized a gain of
$195 million, net of tax of $541 million in 2006 (see Note 5 to our
consolidated financial statements). The effective tax rate on the
gain is higher than the federal statutory rate primarily due to the
nondeductible amounts attributed to goodwill.
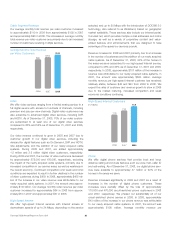
Liquidity and Capital Resources
Our businesses generate significant cash flows from operating
activities. We believe that we will be able to meet our current and
long-term liquidity and capital requirements, including fixed charg-
es, through our cash flows from operating activities; through
existing cash, cash equivalents and investments; through available
borrowings under our existing credit facilities; and through our abil-
ity to obtain future external financing.
We anticipate that we will continue to use a substantial portion of
our cash flows to fund our capital expenditures, to invest in
business opportunities, to meet our debt repayment obligations
and to return capital to investors.
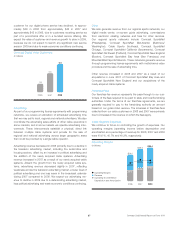
The global financial markets have been and continue to be in
turmoil, with extreme volatility in the equity and credit markets and
with some financial and other institutions experiencing significant
financial distress. As of December 31, 2008, we had approx-
imately $5.5 billion remaining availability under our credit facilities
and no outstanding commercial paper obligations. From 2009 to
2011, our scheduled debt maturities total approximately $5.3 bil-
lion. In addition, neither our access to nor the value of our cash
equivalents or short-term investments have been negatively
affected by the recent liquidity problems of financial institutions.
Although we have attempted to be prudent in our investment
strategy, it is not possible to predict how the financial market
turmoil and the deteriorating economic conditions may affect our
financial position. Additional financial institution failures could
reduce amounts available under committed credit facilities, could
cause losses to the extent cash amounts or the value of securities
exceed government deposit insurance limits, and could restrict our
access to the public equity and debt markets.
Comcast 2008 Annual Report on Form 10-K 30