Comcast 2008 Annual Report Download - page 60
Download and view the complete annual report
Please find page 60 of the 2008 Comcast annual report below. You can navigate through the pages in the report by either clicking on the pages listed below, or by using the keyword search tool below to find specific information within the annual report.-
 1
1 -
2
-
3
-
4
-
5
-
6
-
7
-
8
-
9
-
10
-
11
-
12
-
13
-
14
-
15
-
16
-
17
-
18
-
19
-
20
-
21
-
22
-
23
-
24
-
25
-
26
-
27
-
28
-
29
-
30
-
31
-
32
-
33
-
34
-
35
-
36
-
37
-
38
-
39
-
40
-
41
-
42
-
43
-
44
-
45
-
46
-
47
-
48
-
49
-
 50
50 -
 51
51 -
 52
52 -
 53
53 -
 54
54 -
 55
55 -
 56
56 -
 57
57 -
 58
58 -
 59
59 -
 60
60 -
 61
61 -
 62
62 -
 63
63 -
 64
64 -
 65
65 -
 66
66 -
 67
67 -
 68
68 -
 69
69 -
 70
70 -
71
-
72
-
73
-
74
-
75
-
76
-
77
-
78
-
79
-
80
-
81
-
82
-
83
-
84
-
85
-
86
-
87
-
88
-
89
 |
 |

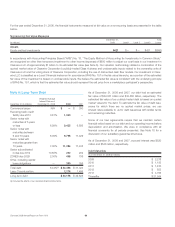
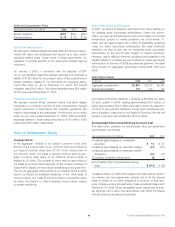
For the year ended December 31, 2008, the financial instruments measured at fair value on a nonrecurring basis are presented in the table
below.
Nonrecurring Fair Value Measures
(in millions)
December 31,
2008 Level 1 Level 2 Level 3
Total
Losses
Assets
Equity method investments $421 $— $— $421 $(600)
In accordance with Accounting Principles Board (“APB”) No. 18, “The Equity Method of Accounting for Investments in Common Stock,”
we recognized an other than temporary impairment to other income (expense) of $600 million to adjust our cost basis in our investment in
Clearwire LLC of approximately $1 billion to its estimated fair value (see Note 6). Our valuation methodology utilized a combination of the
quoted market value of Clearwire Corporation’s publicly traded Class A shares and unobservable inputs related to the ownership units of
Clearwire LLC and the voting stock of Clearwire Corporation, including the use of discounted cash flow models. Our investment in Clear-
wire LLC is classified as a Level 3 financial instrument in accordance SFAS No. 157 in the fair value hierarchy, as a portion of the estimated
fair value of the investment is based on unobservable inputs. We believe the estimated fair value is consistent with the underlying principle
of SFAS No. 157, which is that the estimated fair value should represent the exit price from a marketplace participant’s perspective.
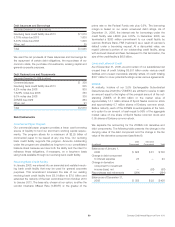
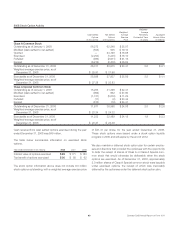
Note 9: Long-Term Debt
December 31 (in millions)
Weighted Average
Interest Rate as of
December 31, 2008 2008 2007
Commercial paper N/A $—$ 300
Revolving bank credit
facility due 2013 0.81% 1,000 —
Senior notes with
maturities of 5 years
or less 6.99% 9,425 6,895
Senior notes with
maturities between
6 and 10 years 6.09% 9,798 11,429
Senior notes with
maturities greater than
10 years 7.00% 11,284 11,435
Senior subordinated
notes due 2012 10.63% 202 202
ZONES due 2029 2.00% 408 706
Other, including capital
lease obligations — 339 356
Total debt 6.44%(a) $ 32,456 $ 31,323
Less: Current portion 2,278 1,495
Long-term debt $ 30,178 $ 29,828
(a) Includes the effects of our derivative financial instruments.
As of December 31, 2008 and 2007, our debt had an estimated
fair value of $32.001 billion and $32.565 billion, respectively. The
estimated fair value of our publicly traded debt is based on quoted
market values for the debt. To estimate the fair value of debt issu-
ances for which there are no quoted market prices, we use
interest rates available to us for debt issuances with similar terms
and remaining maturities.
Some of our loan agreements require that we maintain certain
financial ratios based on our debt and our operating income before
depreciation and amortization. We were in compliance with all
financial covenants for all periods presented. See Note 18 for a
discussion of our subsidiary guarantee structures.
As of December 31, 2008 and 2007, accrued interest was $520
million and $546 million, respectively.
Debt Maturities
As of December 31, 2008 (in millions)
2009 $ 2,278
2010 $ 1,183
2011 $ 1,810
2012 $ 853
2013 $ 4,768
Thereafter $ 21,564
Comcast 2008 Annual Report on Form 10-K 58