Comcast 2008 Annual Report Download - page 31
Download and view the complete annual report
Please find page 31 of the 2008 Comcast annual report below. You can navigate through the pages in the report by either clicking on the pages listed below, or by using the keyword search tool below to find specific information within the annual report.-
 1
1 -
2
-
3
-
4
-
5
-
6
-
7
-
8
-
9
-
10
-
11
-
12
-
13
-
14
-
15
-
16
-
17
-
18
-
19
-
20
-
 21
21 -
 22
22 -
 23
23 -
 24
24 -
 25
25 -
 26
26 -
 27
27 -
 28
28 -
 29
29 -
 30
30 -
 31
31 -
 32
32 -
 33
33 -
 34
34 -
 35
35 -
 36
36 -
 37
37 -
 38
38 -
 39
39 -
 40
40 -
 41
41 -
42
-
43
-
44
-
45
-
46
-
47
-
48
-
49
-
50
-
51
-
52
-
53
-
54
-
55
-
56
-
57
-
58
-
59
-
60
-
61
-
62
-
63
-
64
-
65
-
66
-
67
-
68
-
69
-
70
-
71
-
72
-
73
-
74
-
75
-
76
-
77
-
78
-
79
-
80
-
81
-
82
-
83
-
84
-
85
-
86
-
87
-
88
-
89
 |
 |

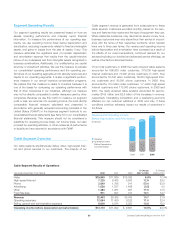
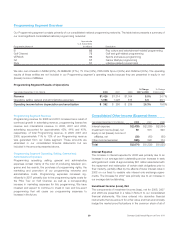
Programming Segment Overview
Our Programming segment consists primarily of our consolidated national programming networks. The table below presents a summary of
our most significant consolidated national programming networks:
Programming Network
Approximate
U.S. Subscribers
(in millions) Description
E! 85 Pop culture and entertainment-related programming
Golf Channel 73 Golf and golf-related programming
VERSUS 66 Sports and leisure programming
G4 57 Gamer lifestyle programming
Style 51 Lifestyle-related programming
We also own interests in MGM (20%), iN DEMAND (51%), TV One (33%), PBS KIDS Sprout (40%) and FEARnet (33%). The operating
results of these entities are not included in our Programming segment’s operating results because they are presented in equity in net
(losses) income of affiliates.
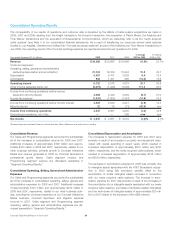
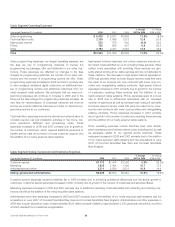
Programming Segment Results of Operations
Year ended December 31 (in millions) 2008 2007 2006
% Change
2007 to 2008
% Change
2006 to 2007
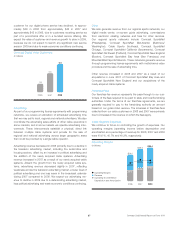
Revenue $1,426 $1,314 $1,054 8.5% 24.7%
Operating, selling, general and administrative expenses 1,064 1,028 815 3.6 26.1
Operating income before depreciation and amortization $ 362 $ 286 $ 239 26.3% 19.8%
Programming Segment Revenue
Programming revenue for 2008 and 2007 increased as a result of
continued growth in advertising revenue, programming license fee
revenue and international revenue. In 2008, 2007 and 2006,
advertising accounted for approximately 43%, 44% and 45%,
respectively, of total Programming revenue. In 2008, 2007 and
2006, approximately 11% to 13% of our Programming revenue
was generated from our Cable segment. These amounts are
eliminated in our consolidated financial statements but are
included in the amounts presented above.
Programming Segment Operating, Selling, General and
Administrative Expenses
Programming operating, selling, general and administrative
expenses consist mainly of the cost of producing television pro-
grams and live events, the purchase of programming rights, the
marketing and promotion of our programming networks and
administrative costs. Programming expenses increased sig-
nificantly in 2007 primarily due to the programming rights costs for
the PGA Tour on Golf Channel, as well as a corresponding
increase in marketing expenses for this programming. We have
invested and expect to continue to invest in new and live-event
programming that will cause our programming expenses to
increase in the future.
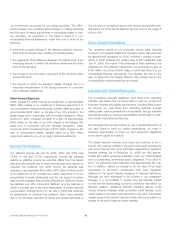
Consolidated Other Income (Expense) Items
Year ended December 31 (in millions) 2008 2007 2006
Interest expense $(2,439) $(2,289) $(2,064)
Investment income (loss), net 89 601 990
Equity in net (losses) income of
affiliates, net (39) (63) (65)
Other income (expense) (285) 522 114
Total $(2,674) $(1,229) $(1,025)
Interest Expense
The increase in interest expense for 2008 was primarily due to an
increase in our average debt outstanding and an increase in early
extinguishment costs of approximately $61 million associated with
the repayment and redemption of certain debt obligations prior to
their maturity, partially offset by the effects of lower interest rates in
2008 on our fixed to variable rate interest rate exchange agree-
ments. The increase for 2007 was primarily due to an increase in
our average debt outstanding.
Investment Income (Loss), Net
The components of investment income (loss), net for 2008, 2007
and 2006 are presented in a table in Note 6 to our consolidated
financial statements. We have entered into derivative financial
instruments that we account for at fair value and that economically
hedge the market price fluctuations in the common stock of all of
29 Comcast 2008 Annual Report on Form 10-K