Comcast 2008 Annual Report Download - page 28
Download and view the complete annual report
Please find page 28 of the 2008 Comcast annual report below. You can navigate through the pages in the report by either clicking on the pages listed below, or by using the keyword search tool below to find specific information within the annual report.-
 1
1 -
2
-
3
-
4
-
5
-
6
-
7
-
8
-
9
-
10
-
11
-
12
-
13
-
14
-
15
-
16
-
17
-
 18
18 -
 19
19 -
 20
20 -
 21
21 -
 22
22 -
 23
23 -
 24
24 -
 25
25 -
 26
26 -
 27
27 -
 28
28 -
 29
29 -
 30
30 -
 31
31 -
 32
32 -
 33
33 -
 34
34 -
 35
35 -
 36
36 -
 37
37 -
 38
38 -
39
-
40
-
41
-
42
-
43
-
44
-
45
-
46
-
47
-
48
-
49
-
50
-
51
-
52
-
53
-
54
-
55
-
56
-
57
-
58
-
59
-
60
-
61
-
62
-
63
-
64
-
65
-
66
-
67
-
68
-
69
-
70
-
71
-
72
-
73
-
74
-
75
-
76
-
77
-
78
-
79
-
80
-
81
-
82
-
83
-
84
-
85
-
86
-
87
-
88
-
89
 |
 |

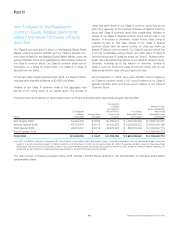
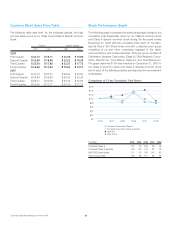
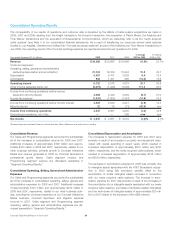
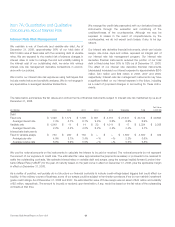
Cable Segment Revenue
Our average monthly total revenue per video customer increased
to approximately $110 in 2008 from approximately $102 in 2007
and approximately $95 in 2006. The increases in average monthly
total revenue per video customer are primarily due to an increased
number of customers receiving multiple services.
A
verage Monthly Total Revenue
per Video Customers
$95
$102
2007
$110
2008
2006
Video
We offer video services ranging from a limited analog service to a
full digital service with access to hundreds of channels, including
premium and pay-per-view channels. Digital video customers may
also subscribe to advanced digital video services, including DVR
and HDTV. As of December 31, 2008, 70% of our video custom-
ers subscribed to at least one of our digital video services,
compared to 63% and 52% as of December 31, 2007 and 2006,
respectively.
Our video revenue continued to grow in 2008 and 2007 due to
customer growth in our digital video services, including the
demand for digital features such as On Demand, DVR and HDTV;
rate adjustments; and the addition of our newly acquired cable
systems. During 2008 and 2007, we added approximately
1.5 million and 2.5 million digital video customers, respectively.
During 2008 and 2007, the number of video customers decreased
by approximately 575,000 and 180,000, respectively, excluding
the impact of the newly acquired cable systems, primarily due to
increased competition in our service areas, as well as weakness in
the overall economy. Continued competition and weak economic
conditions are expected to result in further declines in the number
of video customers during 2009. In 2008, approximately $455 mil-
lion of the increase in our video revenue was attributable to our
newly acquired cable systems. In 2007, the amount was approx-
imately $1.6 billion. Our average monthly video revenue per video
customer increased to approximately $64 in 2008 from approx-
imately $61 in 2007 and approximately $57 in 2006.
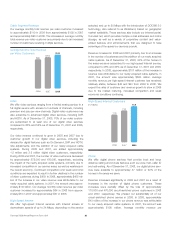
High-Speed Internet
We offer high-speed Internet services with Internet access at
downstream speeds of up to 24 Mbps, depending on the service
selected, and up to 50 Mbps with the introduction of DOCSIS 3.0
technology, also referred to as Wideband, based on geographic
market availability. These services also include our Internet portal,
Comcast.net, which provides multiple e-mail addresses and online
storage, as well as a variety of proprietary content and value-
added features and enhancements that are designed to take
advantage of the speed our services provide.
Revenue increased in 2008 and 2007 primarily due to an increase
in the number of customers and the addition of our newly acquired
cable systems. As of December 31, 2008, 30% of the homes in
the areas we serve subscribed to our high-speed Internet service,
compared to 28% and 25% as of December 31, 2007 and 2006,
respectively. In 2008, approximately $157 million of the increase in
revenue was attributable to our newly acquired cable systems. In
2007, the amount was approximately $640 million. Average
monthly revenue per high-speed Internet customer has remained
relatively stable, between $42 and $43 from 2006 to 2008. We
expect the rates of customer and revenue growth to slow in 2009
due to the market maturing, increased competition and weak
economic conditions continuing.
High-Speed Internet Customers
(in millions)
11.5
13.2
2007
14.9
2008
2006
Phone
We offer digital phone services that provide local and long-
distance calling and include features such as voice mail, caller ID
and call waiting. As of December 31, 2008, our digital phone serv-
ices were available to approximately 47 million or 92% of the
homes in the areas we serve.
Revenue increased significantly in 2008 and 2007 as a result of
increases in the number of digital phone customers. These
increases were partially offset by the loss of approximately
170,000 and 470,000 circuit-switched phone customers in 2008
and 2007, respectively. We phased out substantially all of our
circuit-switched phone service in 2008. In 2008, approximately
$43 million of the increase in our phone revenue was attributable
to our newly acquired cable systems. In 2007, the amount was
approximately $100 million. Average monthly revenue per
Comcast 2008 Annual Report on Form 10-K 26