Comcast 2008 Annual Report Download - page 30
Download and view the complete annual report
Please find page 30 of the 2008 Comcast annual report below. You can navigate through the pages in the report by either clicking on the pages listed below, or by using the keyword search tool below to find specific information within the annual report.-
 1
1 -
2
-
3
-
4
-
5
-
6
-
7
-
8
-
9
-
10
-
11
-
12
-
13
-
14
-
15
-
16
-
17
-
18
-
19
-
 20
20 -
 21
21 -
 22
22 -
 23
23 -
 24
24 -
 25
25 -
 26
26 -
 27
27 -
 28
28 -
 29
29 -
 30
30 -
 31
31 -
 32
32 -
 33
33 -
 34
34 -
 35
35 -
 36
36 -
 37
37 -
 38
38 -
 39
39 -
 40
40 -
41
-
42
-
43
-
44
-
45
-
46
-
47
-
48
-
49
-
50
-
51
-
52
-
53
-
54
-
55
-
56
-
57
-
58
-
59
-
60
-
61
-
62
-
63
-
64
-
65
-
66
-
67
-
68
-
69
-
70
-
71
-
72
-
73
-
74
-
75
-
76
-
77
-
78
-
79
-
80
-
81
-
82
-
83
-
84
-
85
-
86
-
87
-
88
-
89
 |
 |

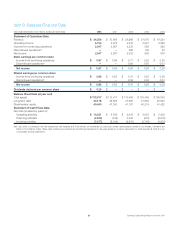
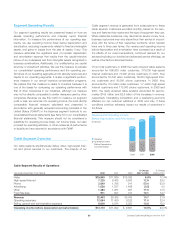
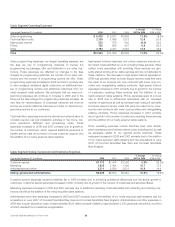
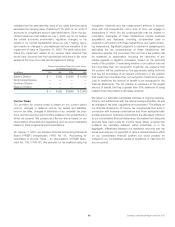
Cable Segment Operating Expenses
Year ended December 31 (in millions) 2008 2007 2006
% Change
2007 to 2008
% Change
2006 to 2007
Video programming $ 6,479 $ 5,813 $4,848 11.5% 19.9%
Technical labor costs 2,138 1,899 1,572 12.6 20.8
High-speed Internet 523 575 435 (9.0) 32.2
Phone 730 685 427 6.6 60.4
Other 2,794 2,437 2,040 14.6 19.5
Total $12,664 $11,409 $9,322 11.0% 22.4%
Video programming expenses, our largest operating expense, are
the fees we pay to programming networks to license the
programming we package, offer and distribute to our video cus-
tomers. These expenses are affected by changes in the fees
charged by programming networks, the number of our video cus-
tomers and the number of programming options we offer. Video
programming expenses increased in 2008 and 2007, primarily due
to rate increases, additional digital customers, an additional num-
ber of programming options and additional customers from our
newly acquired cable systems. We anticipate that our video pro-
gramming expenses will continue to increase in 2009 and in the
future as the fees charged by programming networks increase, as
new fees for retransmission of broadcast networks are incurred
and as we provide additional channels and video on demand pro-
gramming options to our customers.
Technical labor expenses include the internal and external labor to
complete service call and installation activities in the home, net-
work operations, fulfillment and provisioning costs. These
expenses increased in 2008 and 2007 primarily due to growth in
the number of customers, which required additional personnel to
handle service calls and provide in-house customer support and
the addition of our newly acquired cable systems.
High-speed Internet expenses and phone expenses include cer-
tain direct costs identified by us for providing these services. Other
related costs associated with providing these services are gen-
erally shared among all our cable services and are not allocated to
these captions. The decrease in high-speed Internet expenses in
2008 was primarily driven by lower support service costs that were
the result of our entering into new contracts with lower cost pro-
viders and renegotiating existing contracts. High-speed Internet
expenses increased in 2007 primarily due to growth in the number
of customers receiving these services and the addition of our
newly acquired cable systems. Phone expenses grew at a lower
rate in 2008 due to efficiencies associated with an increased
number of customers as well as the least-cost routing of call traffic
and lower support service costs that were the result of our enter-
ing into new contracts with lower cost providers and renegotiating
existing contracts. Phone expenses increased in 2007 primarily
due to growth in the number of customers receiving these services
and the addition of our newly acquired cable systems.
Other operating expenses include franchise fees, pole rentals,
plant maintenance and vehicle-related costs, including fuel, as well
as expenses related to our regional sports networks. These
expenses increased in 2008 and 2007 primarily due to the addition
of our newly acquired cable systems and the acquisitions in June
2007 of Comcast SportsNet Bay Area and Comcast SportsNet
New England.
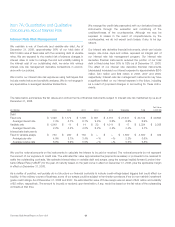
Cable Segment Selling, General and Administrative Expenses
Year ended December 31 (in millions) 2008 2007 2006
% Change
2007 to 2008
% Change
2006 to 2007
Customer service $1,773 $1,674 $1,326 5.9% 26.2%
Marketing 1,625 1,404 1,196 15.7 17.4
Administrative and other 3,211 2,896 2,531 10.9 14.4
Selling, general and administrative $6,609 $5,974 $5,053 10.6% 18.2%
Customer service expenses remained relatively flat in 2008 primarily due to achieving operational efficiencies and the slower growth in
customers. Customer service expenses increased in 2007 primarily due to growth in the number of customers and services offered.
Marketing expenses increased in 2008 and 2007 primarily due to additional marketing costs associated with attracting and retaining cus-
tomers, as well as the addition of the newly acquired cable systems.
Administrative and other expenses increased in 2008 and 2007 primarily due to the addition of our newly acquired cable systems and the
acquisitions in June 2007 of Comcast SportsNet Bay Area and Comcast SportsNet New England. Administrative and other expenses in
2008 also include severance costs of approximately $126 million primarily related to approximately 3,300 personnel reductions, a portion
of which resulted from a divisional reorganization.
Comcast 2008 Annual Report on Form 10-K 28