Comcast 2008 Annual Report Download - page 22
Download and view the complete annual report
Please find page 22 of the 2008 Comcast annual report below. You can navigate through the pages in the report by either clicking on the pages listed below, or by using the keyword search tool below to find specific information within the annual report.-
 1
1 -
2
-
3
-
4
-
5
-
6
-
7
-
8
-
9
-
10
-
11
-
 12
12 -
 13
13 -
 14
14 -
 15
15 -
 16
16 -
 17
17 -
 18
18 -
 19
19 -
 20
20 -
 21
21 -
 22
22 -
 23
23 -
 24
24 -
 25
25 -
 26
26 -
 27
27 -
 28
28 -
 29
29 -
 30
30 -
 31
31 -
 32
32 -
33
-
34
-
35
-
36
-
37
-
38
-
39
-
40
-
41
-
42
-
43
-
44
-
45
-
46
-
47
-
48
-
49
-
50
-
51
-
52
-
53
-
54
-
55
-
56
-
57
-
58
-
59
-
60
-
61
-
62
-
63
-
64
-
65
-
66
-
67
-
68
-
69
-
70
-
71
-
72
-
73
-
74
-
75
-
76
-
77
-
78
-
79
-
80
-
81
-
82
-
83
-
84
-
85
-
86
-
87
-
88
-
89
 |
 |
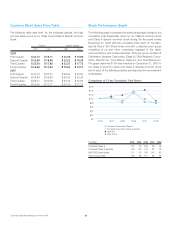
Common Stock Sales Price Table
The following table sets forth, for the indicated periods, the high
and low sales prices of our Class A and Class A Special common
stock.
Class A Class A Special
High Low High Low
2008
First Quarter $ 20.70 $ 16.11 $ 20.45 $ 15.95
Second Quarter $ 22.86 $ 18.48 $ 22.52 $ 18.28
Third Quarter $ 22.54 $ 17.88 $ 22.37 $ 17.76
Fourth Quarter $ 19.62 $ 12.50 $ 19.64 $ 12.10
2007
First Quarter $ 30.18 $ 24.73 $ 29.64 $ 24.54
Second Quarter $ 28.84 $ 25.60 $ 28.43 $ 25.24
Third Quarter $ 29.41 $ 23.08 $ 29.19 $ 22.85
Fourth Quarter $ 24.45 $ 17.37 $ 24.19 $ 17.31
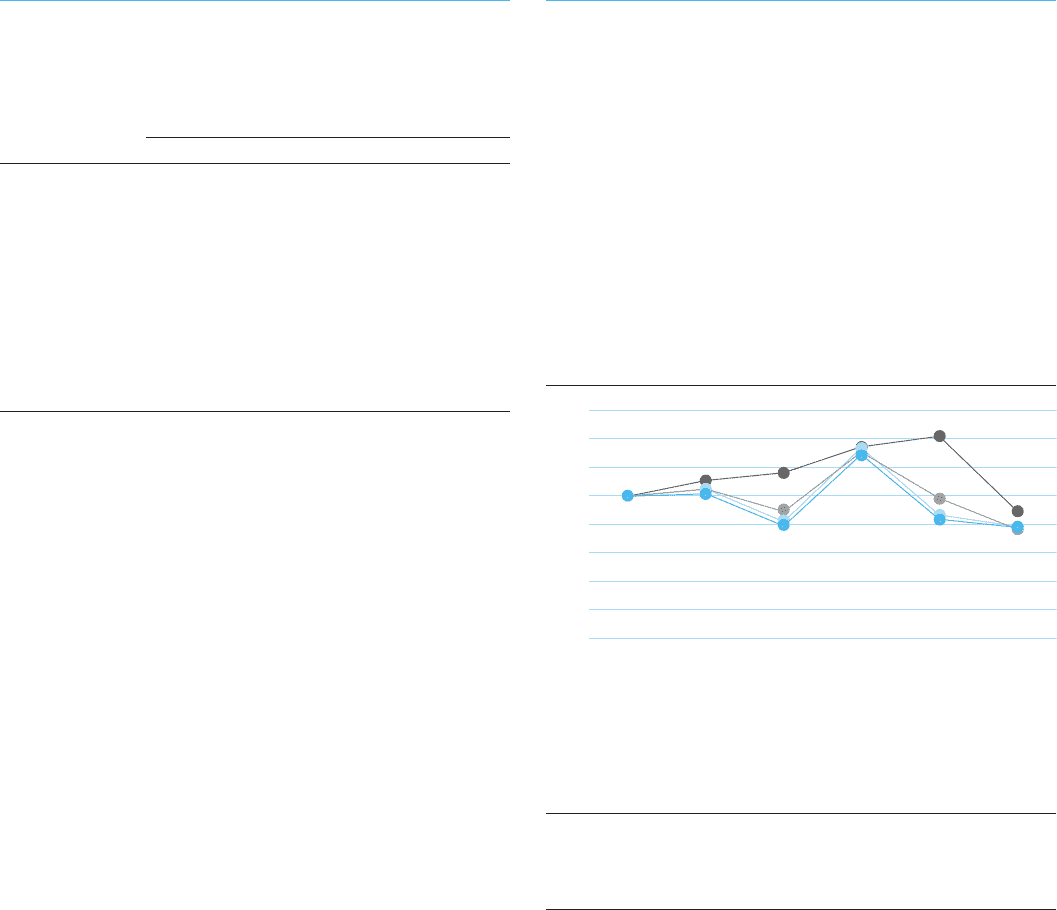
Stock Performance Graph
The following graph compares the yearly percentage change in the
cumulative total shareholder return on our Class A common stock
and Class A Special common stock during the five years ended
December 31, 2008 with the cumulative total return on the Stan-
dard & Poor’s 500 Stock Index and with a selected peer group
consisting of us and other companies engaged in the cable,
communications and media industries. This peer group consists of
Cablevision Systems Corporation (Class A), DISH Network Corpo-
ration, DirecTV Inc., Time Warner Cable Inc. and Time Warner Inc.
The graph assumes $100 was invested on December 31, 2003 in
our Class A common stock and Class A Special common stock
and in each of the following indices and assumes the reinvestment
of dividends.
Comparison of 5 Year Cumulative Total Return
12/05
$0
$80
$60
$40
$20
$100
$120
$140
$160
12/0812/0712/0612/0412/03
•
Comcast Corporation Class A
•
Comcast Corporation Class A Special
•
S&P 500
•
Peer Group
(in dollars) 2004 2005 2006 2007 2008
Comcast Class A 101 79 129 84 78
Comcast Class A Special 105 82 134 87 78
S&P 500 Stock Index 111 116 135 142 90
Peer Group Index 105 89 131 98 76
Comcast 2008 Annual Report on Form 10-K 20