Comcast 2008 Annual Report Download - page 23
Download and view the complete annual report
Please find page 23 of the 2008 Comcast annual report below. You can navigate through the pages in the report by either clicking on the pages listed below, or by using the keyword search tool below to find specific information within the annual report.-
 1
1 -
2
-
3
-
4
-
5
-
6
-
7
-
8
-
9
-
10
-
11
-
12
-
 13
13 -
 14
14 -
 15
15 -
 16
16 -
 17
17 -
 18
18 -
 19
19 -
 20
20 -
 21
21 -
 22
22 -
 23
23 -
 24
24 -
 25
25 -
 26
26 -
 27
27 -
 28
28 -
 29
29 -
 30
30 -
 31
31 -
 32
32 -
 33
33 -
34
-
35
-
36
-
37
-
38
-
39
-
40
-
41
-
42
-
43
-
44
-
45
-
46
-
47
-
48
-
49
-
50
-
51
-
52
-
53
-
54
-
55
-
56
-
57
-
58
-
59
-
60
-
61
-
62
-
63
-
64
-
65
-
66
-
67
-
68
-
69
-
70
-
71
-
72
-
73
-
74
-
75
-
76
-
77
-
78
-
79
-
80
-
81
-
82
-
83
-
84
-
85
-
86
-
87
-
88
-
89
 |
 |

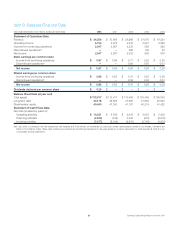
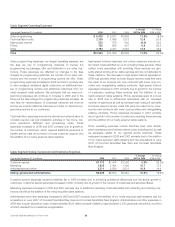
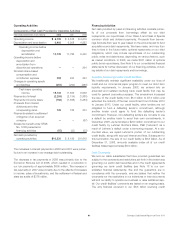
Item 6: Selected Financial Data
Year ended December 31 (in millions, except per share data) 2008 2007 2006 2005 2004
Statement of Operations Data
Revenue $ 34,256 $ 30,895 $ 24,966 $ 21,075 $ 19,221
Operating income 6,732 5,578 4,619 3,521 2,829
Income from continuing operations 2,547 2,587 2,235 828 928
Discontinued operations(a) —— 298 100 42
Net income 2,547 2,587 2,533 928 970
Basic earnings per common share
Income from continuing operations $0.87$ 0.84 $ 0.71 $ 0.25 $ 0.28
Discontinued operations(a) —— 0.09 0.03 0.01
Net income $ 0.87 $ 0.84 $ 0.80 $ 0.28 $ 0.29
Diluted earnings per common share
Income from continuing operations $0.86$ 0.83 $ 0.70 $ 0.25 $ 0.28
Discontinued operations(a) —— 0.09 0.03 0.01
Net income $ 0.86 $ 0.83 $ 0.79 $ 0.28 $ 0.29
Dividends declared per common share $ 0.25 $—$—$—$—
Balance Sheet Data (at year end)
Total assets $ 113,017 $ 113,417 $ 110,405 $ 103,400 $ 105,035
Long-term debt 30,178 29,828 27,992 21,682 20,093
Stockholders’ equity 40,450 41,340 41,167 40,219 41,422
Statement of Cash Flows Data
Net cash provided by (used in):
Operating activities $ 10,231 $ 8,189 $ 6,618 $ 4,835 $ 5,402
Financing activities (2,522) (316) 3,546 (933) (2,516)
Investing activities (7,477) (8,149) (9,872) (3,748) (3,832)
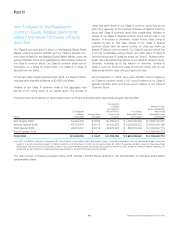
(a) In July 2006, in connection with the transactions with Adelphia and Time Warner, we transferred our previously owned cable systems located in Los Angeles, Cleveland and
Dallas to Time Warner Cable. These cable systems are presented as discontinued operations for the years ended on or before December 31, 2006 (see Item 8, Note 5 to our
consolidated financial statements).
21 Comcast 2008 Annual Report on Form 10-K