Comcast 2008 Annual Report Download - page 75
Download and view the complete annual report
Please find page 75 of the 2008 Comcast annual report below. You can navigate through the pages in the report by either clicking on the pages listed below, or by using the keyword search tool below to find specific information within the annual report.-
 1
1 -
2
-
3
-
4
-
5
-
6
-
7
-
8
-
9
-
10
-
11
-
12
-
13
-
14
-
15
-
16
-
17
-
18
-
19
-
20
-
21
-
22
-
23
-
24
-
25
-
26
-
27
-
28
-
29
-
30
-
31
-
32
-
33
-
34
-
35
-
36
-
37
-
38
-
39
-
40
-
41
-
42
-
43
-
44
-
45
-
46
-
47
-
48
-
49
-
50
-
51
-
52
-
53
-
54
-
55
-
56
-
57
-
58
-
59
-
60
-
61
-
62
-
63
-
64
-
 65
65 -
 66
66 -
 67
67 -
 68
68 -
 69
69 -
 70
70 -
 71
71 -
 72
72 -
 73
73 -
 74
74 -
 75
75 -
 76
76 -
 77
77 -
 78
78 -
 79
79 -
 80
80 -
 81
81 -
 82
82 -
 83
83 -
 84
84 -
 85
85 -
86
-
87
-
88
-
89
 |
 |

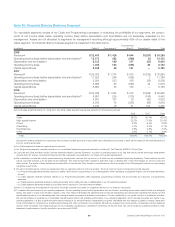
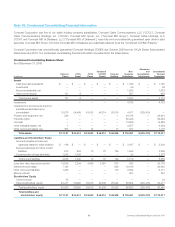
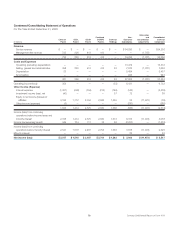
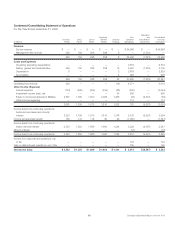
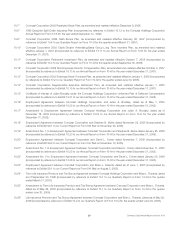
Condensed Consolidating Statement of Operations
For the Year Ended December 31, 2008
(in millions)
Comcast
Parent
CCCL
Parent
CCCH
Parent
Combined
CCHMO
Parents
Comcast
Holdings
Non-
Guarantor
Subsidiaries
Elimination
and
Consolidation
Adjustments
Consolidated
Comcast
Corporation
Revenue
Service revenue $ — $ — $ — $ — $ — $ 34,256 $ — $34,256
Management fee revenue 735 226 413 413 — — (1,787) —
735 226 413 413 — 34,256 (1,787) 34,256
Costs and Expenses
Operating (excluding depreciation) — — — — — 13,472 — 13,472
Selling, general and administrative 358 226 413 413 53 7,976 (1,787) 7,652
Depreciation 23 — — — — 5,434 — 5,457
Amortization — — — — — 943 — 943
381 226 413 413 53 27,825 (1,787) 27,524
Operating income (loss) 354 — — — (53) 6,431 — 6,732
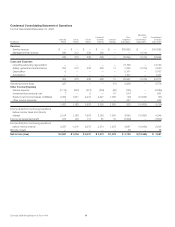
Other Income (Expense)
Interest expense (1,307) (298) (334) (212) (146) (142) — (2,439)
Investment income (loss), net (40) — — — 57 72 — 89
Equity in net income (losses) of
affiliates 3,196 1,712 2,704 2,842 1,455 24 (11,972) (39)
Other income (expense) (5) — — — — (280) — (285)
1,844 1,414 2,370 2,630 1,366 (326) (11,972) (2,674)
Income (loss) from continuing
operations before income taxes and
minority interest 2,198 1,414 2,370 2,630 1,313 6,105 (11,972) 4,058
Income tax (expense) benefit 349 104 117 74 50 (2,227) — (1,533)
Income (loss) from continuing
operations before minority interest 2,547 1,518 2,487 2,704 1,363 3,878 (11,972) 2,525
Minority interest — — — — — 22 — 22
Net income (loss) $ 2,547 $ 1,518 $ 2,487 $ 2,704 $ 1,363 $ 3,900 $ (11,972) $ 2,547
73 Comcast 2008 Annual Report on Form 10-K