Comcast 2008 Annual Report Download - page 59
Download and view the complete annual report
Please find page 59 of the 2008 Comcast annual report below. You can navigate through the pages in the report by either clicking on the pages listed below, or by using the keyword search tool below to find specific information within the annual report.-
 1
1 -
2
-
3
-
4
-
5
-
6
-
7
-
8
-
9
-
10
-
11
-
12
-
13
-
14
-
15
-
16
-
17
-
18
-
19
-
20
-
21
-
22
-
23
-
24
-
25
-
26
-
27
-
28
-
29
-
30
-
31
-
32
-
33
-
34
-
35
-
36
-
37
-
38
-
39
-
40
-
41
-
42
-
43
-
44
-
45
-
46
-
47
-
48
-
 49
49 -
 50
50 -
 51
51 -
 52
52 -
 53
53 -
 54
54 -
 55
55 -
 56
56 -
 57
57 -
 58
58 -
 59
59 -
 60
60 -
 61
61 -
 62
62 -
 63
63 -
 64
64 -
 65
65 -
 66
66 -
 67
67 -
 68
68 -
 69
69 -
70
-
71
-
72
-
73
-
74
-
75
-
76
-
77
-
78
-
79
-
80
-
81
-
82
-
83
-
84
-
85
-
86
-
87
-
88
-
89
 |
 |

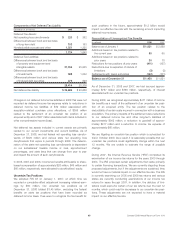
The estimated expense for each of the next five years recognized
in amortization expense and other accounts are presented in the
table below. The amortization of certain intangible assets of our
Programming segment are not recognized as amortization
expense but as a reduction to revenue or as an operating expense
and are presented under the caption “Other Accounts.”
(in millions)
Amortization
Expense
Other
Accounts
2009 $987 $154
2010 $882 $ 94
2011 $748 $ 39
2012 $623 $ 23
2013 $389 $ 6
Note 8: Fair Value of Financial Assets and
Financial Liabilities
Effective January 1, 2008, we adopted the provisions of SFAS
No. 157 that relate to our financial assets and financial liabilities
(“financial instruments”) as discussed in Note 3. SFAS No. 157
establishes a hierarchy that prioritizes fair value measurements
based on the types of inputs used for the various valuation tech-
niques (market approach, income approach and cost approach).
The levels of the hierarchy are described below:
• Level 1: consists of financial instruments whose value is based
on quoted market prices for identical financial instruments in an
active market
• Level 2: consists of financial instruments that are valued using
models or other valuation methodologies. These models use
inputs that are observable either directly or indirectly; Level 2
inputs include (i) quoted prices for similar assets or liabilities in
active markets, (ii) quoted prices for identical or similar assets or
liabilities in markets that are not active, (iii) pricing models whose
inputs are observable for substantially the full term of the finan-
cial instrument and (iv) pricing models whose inputs are derived
principally from or corroborated by observable market data
through correlation or other means for substantially the full term
of the financial instrument
• Level 3: consists of financial instruments whose values are
determined using pricing models that utilize significant inputs
that are primarily unobservable, discounted cash flow
methodologies, or similar techniques, as well as instruments for
which the determination of fair value requires significant
management judgment or estimation
Our assessment of the significance of a particular input to the fair
value measurement requires judgment and may affect the valu-
ation of financial instruments and their classification within the fair
value hierarchy. As required by SFAS No. 157, financial instru-
ments are classified in their entirety based on the lowest level of
inputthatissignificanttothefair value measurement. There have
been no changes in the classification of any financial instruments
within the fair value hierarchy since our adoption of SFAS No. 157.
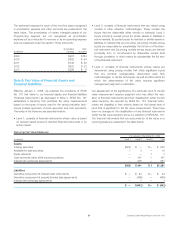
Our financial instruments that are accounted for at fair value on a
recurring basis are presented in the table below.
Recurring Fair Value Measures
Fair value as of December 31, 2008
(in millions) Level 1 Level 2 Level 3 Total
Assets
Trading securities $932 $ — $— $ 932
Available-for-sale securities 73—10
Equity warrants —— 1 1
Cash surrender value of life insurance policies — 147 — 147
Interest rate exchange agreements — 291 — 291
$939 $ 441 $ 1 $1,381
Liabilities
Derivative component of indexed debt instruments $ — $ 23 $— $ 23
Derivative component of prepaid forward sale agreements — (466) — (466)
Interest rate exchange agreements — 1 — 1
$ — $(442) $— $ (442)
57 Comcast 2008 Annual Report on Form 10-K