Comcast 2008 Annual Report Download - page 4
Download and view the complete annual report
Please find page 4 of the 2008 Comcast annual report below. You can navigate through the pages in the report by either clicking on the pages listed below, or by using the keyword search tool below to find specific information within the annual report.-
 1
1 -
 2
2 -
 3
3 -
 4
4 -
 5
5 -
 6
6 -
 7
7 -
 8
8 -
 9
9 -
 10
10 -
 11
11 -
 12
12 -
 13
13 -
 14
14 -
 15
15 -
16
-
17
-
18
-
19
-
20
-
21
-
22
-
23
-
24
-
25
-
26
-
27
-
28
-
29
-
30
-
31
-
32
-
33
-
34
-
35
-
36
-
37
-
38
-
39
-
40
-
41
-
42
-
43
-
44
-
45
-
46
-
47
-
48
-
49
-
50
-
51
-
52
-
53
-
54
-
55
-
56
-
57
-
58
-
59
-
60
-
61
-
62
-
63
-
64
-
65
-
66
-
67
-
68
-
69
-
70
-
71
-
72
-
73
-
74
-
75
-
76
-
77
-
78
-
79
-
80
-
81
-
82
-
83
-
84
-
85
-
86
-
87
-
88
-
89
 |
 |

• the initiation of a quarterly dividend of $0.0625 per share in
February 2008; we declared dividends of approximately $727
million in 2008, of which $547 million were paid during 2008
We operate our businesses in an intensely competitive environ-
ment. Competition for the cable services we offer consists
primarily of direct broadcast satellite (“DBS”) operators and phone
companies. In 2008, our competitors continued to add features
and adopt aggressive pricing and packaging for services that are
comparable to the services we offer and the local phone compa-
nies have continued to expand their service areas. A substantial
portion of our revenue comes from residential customers whose
spending patterns may be affected by prevailing economic con-
ditions. Intensifying competition and a weakening economy
affected our net customer additions in 2008 and may, if these
conditions continue, adversely impact our results of operations in
the future.
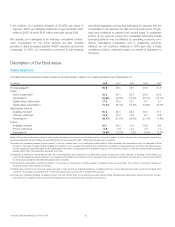
Description of Our Businesses
Cable Segment
The table below summarizes certain customer and penetration data for our cable operations as of December 31.
(in millions) 2008 2007 2006 2005 2004
Homes passed(a) 50.6 48.5 45.7 38.6 37.8
Video
Video customers(b) 24.2 24.1 23.4 20.3 20.5
Penetration(c) 47.8% 49.6% 51.3% 52.7% 54.1%
Digital video customers(d) 17.0 15.2 12.1 9.1 8.1
Digital video penetration(c) 70.3% 63.1% 51.9% 44.8% 39.4%
High-speed Internet
Available homes(e) 50.3 48.1 45.2 38.2 37.1
Internet customers 14.9 13.2 11.0 8.1 6.6
Penetration(c) 29.7% 27.5% 24.4% 21.1% 17.8%
Phone
Available homes(e) 46.7 42.2 31.5 19.6 8.9
Phone customers 6.5 4.6 2.4 1.2 1.1
Penetration(c) 13.9% 10.8% 7.6% 6.0% 12.2%
Basis of Presentation: Information related to cable system acquisitions is included from the date acquired. Information related to cable systems sold or exchanged is excluded for
all periods presented. All percentages are calculated based on actual amounts. Minor differences may exist due to rounding.
(a) Homes are considered passed (“homes passed”) if we can connect them to our distribution system without further extending the transmission lines. As described in Note
(b) below, in the case of certain multiple dwelling units (“MDUs”), such as apartment buildings and condominium complexes, homes passed are counted onanadjustedbasis.
Homes passed is an estimate based on the best available information. Homes passed and available homes do not include the number of small and medium-sized businesses
passed, which cannot be reasonably estimated at this time.
(b) Generally, a dwelling or commercial unit with one or more television sets connected to our distribution system counts as one video customer. In the caseofsomeMDUs,we
count homes passed and video customers on a Federal Communications Commission (“FCC”) equivalent basis by dividing total revenue received from a contract with an MDU
by the standard residential rate where the specific MDU is located.
(c) Penetration is calculated by dividing the number of customers by the number of homes passed or available homes, as appropriate. The number of customers includes our
small and medium-sized business customers.
(d) Digital video customers are those who receive any level of video service via digital transmissions. A dwelling with one or more digital set-top boxes counts as one digital video
customer. On average, as of December 31, 2008, each digital video customer had 1.6 digital set-top boxes.
(e) Homes are considered available (“available homes”) if we can connect them to our distribution system without further upgrading the transmission lines and if we offer the serv-
ice in that area. Available homes for phone include digital and circuit-switched homes. See also note (a) above.
Comcast 2008 Annual Report on Form 10-K 2