Comcast 2008 Annual Report Download - page 26
Download and view the complete annual report
Please find page 26 of the 2008 Comcast annual report below. You can navigate through the pages in the report by either clicking on the pages listed below, or by using the keyword search tool below to find specific information within the annual report.-
 1
1 -
2
-
3
-
4
-
5
-
6
-
7
-
8
-
9
-
10
-
11
-
12
-
13
-
14
-
15
-
 16
16 -
 17
17 -
 18
18 -
 19
19 -
 20
20 -
 21
21 -
 22
22 -
 23
23 -
 24
24 -
 25
25 -
 26
26 -
 27
27 -
 28
28 -
 29
29 -
 30
30 -
 31
31 -
 32
32 -
 33
33 -
 34
34 -
 35
35 -
 36
36 -
37
-
38
-
39
-
40
-
41
-
42
-
43
-
44
-
45
-
46
-
47
-
48
-
49
-
50
-
51
-
52
-
53
-
54
-
55
-
56
-
57
-
58
-
59
-
60
-
61
-
62
-
63
-
64
-
65
-
66
-
67
-
68
-
69
-
70
-
71
-
72
-
73
-
74
-
75
-
76
-
77
-
78
-
79
-
80
-
81
-
82
-
83
-
84
-
85
-
86
-
87
-
88
-
89
 |
 |

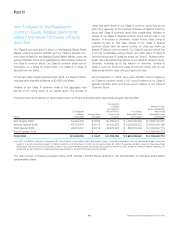
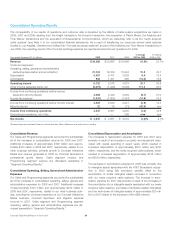
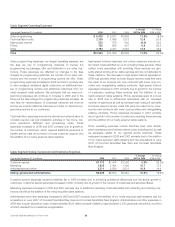
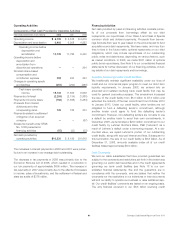
Consolidated Operating Results
The comparability of our results of operations and customer data is impacted by the effects of cable system acquisitions we made in
2008, 2007 and 2006 resulting from the Insight transaction, the Houston transaction, the acquisition of Patriot Media, the Adelphia and
Time Warner transactions and the acquisition of Susquehanna Communications, which we collectively refer to as the “newly acquired
cable systems” (see Note 5 to our consolidated financial statements). As a result of transferring our previously owned cable systems
located in Los Angeles, Cleveland and Dallas (the “Comcast exchange systems”) as part of the Adelphia and Time Warner transactions in
July 2006, the operating results of the Comcast exchange systems are reported as discontinued operations for 2006.
Year ended December 31 (in millions) 2008 2007 2006
% Change
2007 to 2008
% Change
2006 to 2007
Revenue $ 34,256 $ 30,895 $ 24,966 10.9% 23.7%
Costs and expenses:
Operating, selling, general and administrative
(excluding depreciation and amortization) 21,124 19,109 15,524 10.5 23.1
Depreciation 5,457 5,107 3,828 6.9 33.4
Amortization 943 1,101 995 (14.3) 10.6
Operating income 6,732 5,578 4,619 20.7 20.8
Other income (expense) items, net (2,674) (1,229) (1,025) 117.4 20.0
Income from continuing operations before income
taxes and minority interest 4,058 4,349 3,594 (6.7) 21.0
Income tax expense (1,533) (1,800) (1,347) (14.8) 33.6
Income from continuing operations before minority interest 2,525 2,549 2,247 (0.9) 13.4
Minority interest 22 38 (12) (43.9) n/m
Income from continuing operations 2,547 2,587 2,235 (1.6) 15.8
Discontinued operations, net of tax —— 298 n/m n/m
Net income $ 2,547 $ 2,587 $ 2,533 (1.6)% 2.1%
All percentages are calculated based on actual amounts. Minor differences may exist due to rounding.
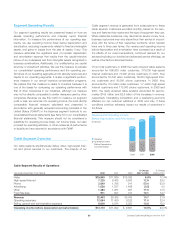
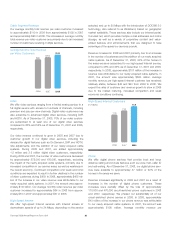
Consolidated Revenue
Our Cable and Programming segments accounted for substantially
all of the increases in consolidated revenue for 2008 and 2007.
Additional increases of approximately $129 million and approx-
imately $103 million in 2008 and 2007, respectively, related to our
other business activities, primarily growth in Comcast Interactive
Media and revenue generated in 2008 by Comcast Spectacor’s
professional sports teams. Cable segment revenue and
Programming segment revenue are discussed separately in
“Segment Operating Results.”
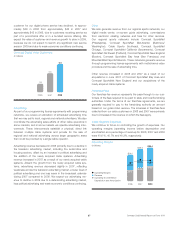
Consolidated Operating, Selling, General and Administrative
Expenses
Our Cable and Programming segments accounted for substantially
all of the increases in consolidated operating, selling, general and
administrative expenses for 2008 and 2007. Additional increases
of approximately $103 million and approximately $210 million in
2008 and 2007, respectively, related to our other business activ-
ities, including the continued expansion of our Comcast Interactive
Media business, Comcast Spectacor and litigation expense
incurred in 2007. Cable segment and Programming segment
operating, selling, general and administrative expenses are dis-
cussed separately in “Segment Operating Results.”
Consolidated Depreciation and Amortization
The increases in depreciation expense for 2008 and 2007 were
primarily a result of an increase in property and equipment asso-
ciated with capital spending in recent years, which resulted in
increased depreciation of approximately $210 million and $700
million, respectively, and the newly acquired cable systems, which
resulted in increased depreciation of approximately $138 million
and $530 million, respectively.
The decrease in amortization expense for 2008 was primarily due
to intangible assets associated with the AT&T Broadband acquis-
ition in 2002 being fully amortized, partially offset by the
amortization of similar intangible assets recorded in connection
with our newly acquired cable systems. The increase in amor-
tization expense for 2007 was primarily a result of the increases in
the amortization of our intangible assets associated with our newly
acquired cable systems, purchases of software-related intangibles
and the write-down of intangible assets of approximately $30 mil-
lion in 2007 related to the shutdown of the AZN network.
Comcast 2008 Annual Report on Form 10-K 24