Cincinnati Bell 2013 Annual Report Download - page 61
Download and view the complete annual report
Please find page 61 of the 2013 Cincinnati Bell annual report below. You can navigate through the pages in the report by either clicking on the pages listed below, or by using the keyword search tool below to find specific information within the annual report.-
 1
1 -
2
-
3
-
4
-
5
-
6
-
7
-
8
-
9
-
10
-
11
-
12
-
13
-
14
-
15
-
16
-
17
-
18
-
19
-
20
-
21
-
22
-
23
-
24
-
25
-
26
-
27
-
28
-
29
-
30
-
31
-
32
-
33
-
34
-
35
-
36
-
37
-
38
-
39
-
40
-
41
-
42
-
43
-
44
-
45
-
46
-
47
-
48
-
49
-
50
-
 51
51 -
 52
52 -
 53
53 -
 54
54 -
 55
55 -
 56
56 -
 57
57 -
 58
58 -
 59
59 -
 60
60 -
 61
61 -
 62
62 -
 63
63 -
 64
64 -
 65
65 -
 66
66 -
 67
67 -
 68
68 -
 69
69 -
 70
70 -
 71
71 -
72
-
73
-
74
-
75
-
76
-
77
-
78
-
79
-
80
-
81
-
82
-
83
-
84
-
85
-
86
-
87
-
88
-
89
-
90
-
91
-
92
-
93
-
94
-
95
-
96
-
97
-
98
-
99
-
100
-
101
-
102
-
103
-
104
-
105
-
106
-
107
-
108
-
109
-
110
-
111
-
112
-
113
-
114
-
115
-
116
-
117
-
118
-
119
-
120
-
121
-
122
-
123
-
124
-
125
-
126
-
127
-
128
-
129
-
130
-
131
-
132
-
133
-
134
-
135
-
136
-
137
-
138
-
139
-
140
-
141
-
142
-
143
-
144
-
145
-
146
-
147
-
148
-
149
-
150
-
151
-
152
-
153
-
154
-
155
-
156
-
157
-
158
-
159
-
160
-
161
-
162
-
163
-
164
-
165
-
166
-
167
-
168
-
169
-
170
-
171
-
172
-
173
-
174
-
175
-
176
-
177
-
178
-
179
-
180
-
181
-
182
-
183
-
184
-
185
-
186
-
187
-
188
-
189
-
190
-
191
-
192
-
193
-
194
-
195
-
196
-
197
-
198
-
199
-
200
-
201
-
202
-
203
-
204
-
205
-
206
-
207
-
208
-
209
-
210
-
211
-
212
-
213
-
214
-
215
-
216
-
217
-
218
-
219
-
220
-
221
-
222
-
223
-
224
-
225
-
226
-
227
-
228
-
229
-
230
-
231
-
232
-
233
-
234
-
235
-
236
-
237
-
238
-
239
-
240
-
241
-
242
-
243
-
244
-
245
-
246
-
247
-
248
-
249
-
250
-
251
-
252
-
253
-
254
-
255
-
256
-
257
-
258
-
259
-
260
-
261
-
262
-
263
-
264
-
265
-
266
-
267
-
268
-
269
-
270
-
271
-
272
-
273
-
274
-
275
-
276
-
277
-
278
-
279
-
280
-
281
-
282
-
283
-
284
-
285
-
286
-
287
-
288
-
289
-
290
-
291
-
292
 |
 |

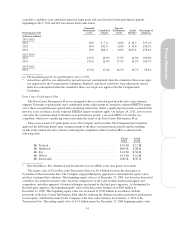
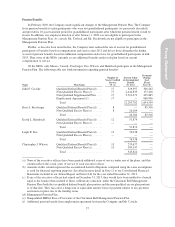
(d) Non-equity incentive plan compensation represents amounts earned for annual performance-based cash incentives, long-term
performance plan cash-settled awards and Data Center Performance Plan awards. The table below shows the amounts earned for each of
these awards:
Name Year
Annual
Performance-Based
Cash Incentive ($)
Long-Term
Cash-Settled
Performance Units
($) (1)
Data Center
Performance Plan
Cash Incentive
($)(2) Total ($)
John F. Cassidy .................... 2013 — 682,402 — 682,402
2012 1,354,722 1,522,478 — 2,877,200
2011 1,242,718 1,265,041 — 2,507,759
Kurt A. Freyberger ................. 2013 — — 1,593,534 1,593,534
2012 441,238 — — 441,238
2011 324,190 — — 324,190
Theodore H. Torbeck ............... 2013 949,950 — 2,231,840 3,181,790
2012 970,045 — — 970,045
2011 1,025,838 — — 1,025,838
David L. Heimbach ................. 2013 404,483 57,702 267,821 730,006
Leigh R. Fox ...................... 2013 306,623 36,064 714,189 1,056,876
Christopher J. Wilson ............... 2013 268,132 — 1,580,143 1,848,275
2012 284,111 — — 284,111
2011 301,223 — — 301,223
Joshua T. Duckworth ................ 2013 86,023 — 107,128 193,151
(1) The amounts shown above for long-term cash-settled performance units earned by Mr. Cassidy represent: (1) the amount earned in
2013 and paid in 2014 for the 2013 performance period related to cash-payment performance awards granted in January 2011 for
the 2011-2013 performance cycle (2) the amount earned in 2012 and paid in 2013 for the 2012 performance period related to cash-
payment performance awards granted in January 2010 for the 2010-2012 performance cycle and January 2011 for the 2011-2012
performance cycle, (3) the amount earned in 2011 and paid in 2012 for the 2011 performance period related to cash-payment
performance awards granted in January 2009 for the 2009-2011 performance cycle, January 2010 for the 2010-2011 performance
cycle, and January 2011 for the 2011 performance cycle. The amounts shown above for long-term cash-settled performance units
earned by Messrs. Fox and Heimbach represent: (1) the amount earned in 2013 and paid in 2014 for the 2013 performance period
related to cash-payment performance awards granted in January 2012 for the 2012-2013 performance cycle.
(2) The amounts shown above represent the amounts paid in 2013 for the long-term Data Center Performance Plan. Refer to pages 41-
42 for additional details on the plan.
(e) The amounts shown in this column for Messrs. Cassidy, Freyberger, Fox, Heimbach and Wilson represent the one-year increase in the
value of their qualified defined benefit plan and nonqualified excess plan for 2013, 2012 and 2011, respectively, projected forward to age
65 for each executive with interest credited at 3.5%, which is the rate a terminated participant would then be given (such interest rate was
increased to 4.0% effective as of March 1, 2012) and then discounted back to the respective year at the discount rate (4.2% for 2013,
3.3% for 2012 and 3.90% for 2011) required under ASC 960. The present value of the accrued pension benefits decreased in 2013
primarily due to an increase in the applicable discount rate and improved market performance of pension assets. The Company froze its
qualified pension plan for management employees in 2009; therefore, Mr. Torbeck and Mr. Duckworth are not entitled to any benefits
under this plan. None of the executives receive any preferential treatment or above-market interest under the Company’s retirement
plans.
(f) For each NEO except Mr. Freyberger, the amount represents the Company’s 401(k) match. Under the terms of the Cincinnati Bell Inc.
Retirement Savings Plan, the Company’s matching contribution is equal to 100% on the first 3% and 50% on the next 2% of
contributions made to the plan by the participant. Eligible compensation includes base wages plus any incentive paid to eligible
participants. The maximum company matching contribution is $10,000. For Mr. Freyberger, this amount represents the Company’s 401k
match and $930,000 due to him for a consulting agreement entered into upon his resignation, effective September 30, 2013.
(g) Mr. Cassidy retired from his position as President and Chief Executive Officer effective January 31, 2013 and assumed the role of Vice
Chairman of the Board. Mr. Cassidy retired from the Board effective December 31, 2013.
(h) Mr. Freyberger resigned as Chief Financial Officer on September 30, 2013.
(i) Mr. Torbeck was appointed Chief Executive Officer on January 31, 2013.
(j) Mr. Heimbach was appointed Chief Operating Officer on November 20, 2013.
(k) Mr. Fox was appointed Chief Financial Officer on October 1, 2013.
(l) Mr. Duckworth was appointed Vice President, Investor Relations and Controller on July 9, 2013.
51
Proxy Statement