Cincinnati Bell 2013 Annual Report Download - page 115
Download and view the complete annual report
Please find page 115 of the 2013 Cincinnati Bell annual report below. You can navigate through the pages in the report by either clicking on the pages listed below, or by using the keyword search tool below to find specific information within the annual report.-
 1
1 -
2
-
3
-
4
-
5
-
6
-
7
-
8
-
9
-
10
-
11
-
12
-
13
-
14
-
15
-
16
-
17
-
18
-
19
-
20
-
21
-
22
-
23
-
24
-
25
-
26
-
27
-
28
-
29
-
30
-
31
-
32
-
33
-
34
-
35
-
36
-
37
-
38
-
39
-
40
-
41
-
42
-
43
-
44
-
45
-
46
-
47
-
48
-
49
-
50
-
51
-
52
-
53
-
54
-
55
-
56
-
57
-
58
-
59
-
60
-
61
-
62
-
63
-
64
-
65
-
66
-
67
-
68
-
69
-
70
-
71
-
72
-
73
-
74
-
75
-
76
-
77
-
78
-
79
-
80
-
81
-
82
-
83
-
84
-
85
-
86
-
87
-
88
-
89
-
90
-
91
-
92
-
93
-
94
-
95
-
96
-
97
-
98
-
99
-
100
-
101
-
102
-
103
-
104
-
 105
105 -
 106
106 -
 107
107 -
 108
108 -
 109
109 -
 110
110 -
 111
111 -
 112
112 -
 113
113 -
 114
114 -
 115
115 -
 116
116 -
 117
117 -
 118
118 -
 119
119 -
 120
120 -
 121
121 -
 122
122 -
 123
123 -
 124
124 -
 125
125 -
126
-
127
-
128
-
129
-
130
-
131
-
132
-
133
-
134
-
135
-
136
-
137
-
138
-
139
-
140
-
141
-
142
-
143
-
144
-
145
-
146
-
147
-
148
-
149
-
150
-
151
-
152
-
153
-
154
-
155
-
156
-
157
-
158
-
159
-
160
-
161
-
162
-
163
-
164
-
165
-
166
-
167
-
168
-
169
-
170
-
171
-
172
-
173
-
174
-
175
-
176
-
177
-
178
-
179
-
180
-
181
-
182
-
183
-
184
-
185
-
186
-
187
-
188
-
189
-
190
-
191
-
192
-
193
-
194
-
195
-
196
-
197
-
198
-
199
-
200
-
201
-
202
-
203
-
204
-
205
-
206
-
207
-
208
-
209
-
210
-
211
-
212
-
213
-
214
-
215
-
216
-
217
-
218
-
219
-
220
-
221
-
222
-
223
-
224
-
225
-
226
-
227
-
228
-
229
-
230
-
231
-
232
-
233
-
234
-
235
-
236
-
237
-
238
-
239
-
240
-
241
-
242
-
243
-
244
-
245
-
246
-
247
-
248
-
249
-
250
-
251
-
252
-
253
-
254
-
255
-
256
-
257
-
258
-
259
-
260
-
261
-
262
-
263
-
264
-
265
-
266
-
267
-
268
-
269
-
270
-
271
-
272
-
273
-
274
-
275
-
276
-
277
-
278
-
279
-
280
-
281
-
282
-
283
-
284
-
285
-
286
-
287
-
288
-
289
-
290
-
291
-
292
 |
 |

Form 10-K Part II Cincinnati Bell Inc.
2013 Compared to 2012
Revenues
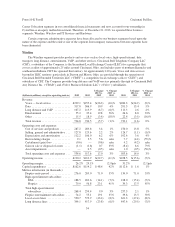
Voice local service revenue includes local service, digital trunking, switched access, information services,
and other value-added services such as caller identification, voicemail, call waiting, and call return. Voice local
service revenue was $229.1 million in 2013, down $26.3 million compared to 2012. Strategic voice service
revenue was $17.9 million in 2013, up $4.3 million compared to 2012, primarily due to the 31% growth in
Fioptics voice lines, which totaled 53,300 at December 31, 2013. Legacy voice services revenue was $204.2
million in 2013, down $29.9 million compared to 2012. The decrease in revenue is primarily due to fewer local
access lines compared to a year ago. Access lines within the segment’s ILEC territory decreased by 35,000, or
7%, to 476,000 at December 31, 2013 from 511,000 at December 31, 2012. The Company had 54,700 CLEC
access lines at December 31, 2013 compared to 62,900 access lines at December 31, 2012. The segment
continues to lose access lines as a result of, among other factors, customers electing to solely use wireless service
in lieu of traditional local wireline service, Company-initiated disconnections of customers with credit problems,
and customers electing to use service from other providers. The remaining decrease is due to a $0.7 million
reduction in integration voice service revenue in 2013 compared to 2012.
Data revenue consists of Fioptics high-speed and DSL internet access, data transport, and interconnection
services. Data revenue was $317.8 million in 2013, up $10.9 million compared to 2012. Strategic data revenue
was $122.1 million in 2013, up 24% compared to the prior year. Revenue from Fioptics high-speed internet
service increased to $27.9 million in 2013, up from $18.1 million in the prior year due to a 41% increase in
subscribers. The remaining increase is primarily due to increases in strategic data for business customers which
was up 17% year-over-year and totaled $94.2 million in 2013. Legacy data revenue was $195.7 million in 2013,
down $12.5 million compared to the prior year. This is primarily due to our business customers migrating to
higher bandwidth data transport products and a 7% decrease in our legacy DSL subscriber base.
Long distance and VoIP revenue was $107.2 million in 2013, a decrease of $6.7 million compared to 2012.
Strategic revenue was $51.1 million in 2013, relatively flat compared to the prior year. Growth in private-line
and VoIP services totaled $2.1 million, but was more than offset by a decrease in audio conferencing revenue
primarily as a result of the loss of one large customer. Legacy revenue was $52.1 million in 2013, a decrease of
$5.0 million compared to 2012 primarily due to a 6% decrease in long distance lines as both consumers and
business customers are migrating to VoIP or wireless services. The remaining decrease is due to a $1.2 million
decrease in integration services compared to the prior year.
Entertainment revenue was $55.2 million in 2013, up $19.8 million compared to the prior year and was
driven by the growth in Fioptics. Fioptics entertainment revenue grew by $19.4 million in 2013, primarily due to
a 35% increase in Fioptics entertainment subscribers. As of December 31, 2013, the segment had 74,200 Fioptics
entertainment subscribers. The Company continues to expand its Fioptics service area as there is strong consumer
demand for this service.
Other revenue was $15.5 million in 2013, a decrease of $3.4 million compared to the prior year. This
decrease was primarily the result of a reduction of $2.3 million and $0.8 million in legacy and integration other
revenue compared to 2012.
Costs and Expenses
Cost of services and products was $287.2 million in 2013, an increase of $3.4 million compared to 2012.
This increase was largely attributable to an $8.6 million increase in programming rates and higher payroll costs
of $5.8 million to support strategic revenue growth. These increases were partially offset by a $5.6 million
reduction in operating taxes due primarily to a reduction in Universal Service Fund (“USF”) charges, a $1.2
million reduction in benefit costs driven by the pension amendments, a $1.8 million reduction in call center costs
associated with outsourcing that function and $2.8 million due to lower network costs associated with decreased
long distance and VoIP revenue.
SG&A expenses were $127.8 million in 2013, an increase of $2.2 million compared to the prior year. This
increase was mainly driven by higher Fioptics advertising costs and non-employee commission fees.
35
Form 10-K