Cincinnati Bell 2013 Annual Report Download - page 120
Download and view the complete annual report
Please find page 120 of the 2013 Cincinnati Bell annual report below. You can navigate through the pages in the report by either clicking on the pages listed below, or by using the keyword search tool below to find specific information within the annual report.-
 1
1 -
2
-
3
-
4
-
5
-
6
-
7
-
8
-
9
-
10
-
11
-
12
-
13
-
14
-
15
-
16
-
17
-
18
-
19
-
20
-
21
-
22
-
23
-
24
-
25
-
26
-
27
-
28
-
29
-
30
-
31
-
32
-
33
-
34
-
35
-
36
-
37
-
38
-
39
-
40
-
41
-
42
-
43
-
44
-
45
-
46
-
47
-
48
-
49
-
50
-
51
-
52
-
53
-
54
-
55
-
56
-
57
-
58
-
59
-
60
-
61
-
62
-
63
-
64
-
65
-
66
-
67
-
68
-
69
-
70
-
71
-
72
-
73
-
74
-
75
-
76
-
77
-
78
-
79
-
80
-
81
-
82
-
83
-
84
-
85
-
86
-
87
-
88
-
89
-
90
-
91
-
92
-
93
-
94
-
95
-
96
-
97
-
98
-
99
-
100
-
101
-
102
-
103
-
104
-
105
-
106
-
107
-
108
-
109
-
 110
110 -
 111
111 -
 112
112 -
 113
113 -
 114
114 -
 115
115 -
 116
116 -
 117
117 -
 118
118 -
 119
119 -
 120
120 -
 121
121 -
 122
122 -
 123
123 -
 124
124 -
 125
125 -
 126
126 -
 127
127 -
 128
128 -
 129
129 -
 130
130 -
131
-
132
-
133
-
134
-
135
-
136
-
137
-
138
-
139
-
140
-
141
-
142
-
143
-
144
-
145
-
146
-
147
-
148
-
149
-
150
-
151
-
152
-
153
-
154
-
155
-
156
-
157
-
158
-
159
-
160
-
161
-
162
-
163
-
164
-
165
-
166
-
167
-
168
-
169
-
170
-
171
-
172
-
173
-
174
-
175
-
176
-
177
-
178
-
179
-
180
-
181
-
182
-
183
-
184
-
185
-
186
-
187
-
188
-
189
-
190
-
191
-
192
-
193
-
194
-
195
-
196
-
197
-
198
-
199
-
200
-
201
-
202
-
203
-
204
-
205
-
206
-
207
-
208
-
209
-
210
-
211
-
212
-
213
-
214
-
215
-
216
-
217
-
218
-
219
-
220
-
221
-
222
-
223
-
224
-
225
-
226
-
227
-
228
-
229
-
230
-
231
-
232
-
233
-
234
-
235
-
236
-
237
-
238
-
239
-
240
-
241
-
242
-
243
-
244
-
245
-
246
-
247
-
248
-
249
-
250
-
251
-
252
-
253
-
254
-
255
-
256
-
257
-
258
-
259
-
260
-
261
-
262
-
263
-
264
-
265
-
266
-
267
-
268
-
269
-
270
-
271
-
272
-
273
-
274
-
275
-
276
-
277
-
278
-
279
-
280
-
281
-
282
-
283
-
284
-
285
-
286
-
287
-
288
-
289
-
290
-
291
-
292
 |
 |
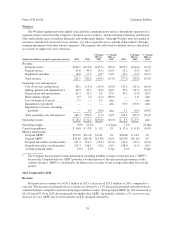
combined with a decrease in voice minutes of use, partially offset by higher data usage. The subscriber losses are
attributed to competitive pressure resulting from, among other factors, competitors’ premium handsets and
competitors’ service on new LTE networks.
Total postpaid ARPU for 2012 increased to $51.29 from $50.06 in 2011 driven primarily by the higher data
ARPU, but partially offset by a 4% year-over-year decrease in voice ARPU due to fewer minutes used by
postpaid subscribers.
At December 31, 2012, the Company had 101,000 postpaid smartphone subscribers, a 5% decrease
compared to 106,000 such subscribers at December 31, 2011. As of December 31, 2012, these postpaid
smartphone subscribers represented 40% of the total postpaid subscriber base, up from 34% at the end of 2011.
The higher smartphone penetration drove a data ARPU of $17.11 for 2012, up 18% compared to 2011.
Prepaid service revenue was $49.9 million in 2012, a decrease of $3.3 million compared to the prior year.
The number of prepaid subscribers at December 31, 2012 was 146,500, a decrease of 1% compared to the prior
year. During 2012, higher data usage by prepaid smartphone users was largely offset by lower voice rates
resulting in a prepaid ARPU of $28.48, comparable to $28.58 generated in 2011.
Equipment and other revenue for 2012 decreased by $7.9 million to $17.3 million in 2012 primarily as a
result of the continued postpaid subscriber losses which drove fewer activations and upgrades in 2012, combined
with the impact of a large nonrecurring equipment sale to a wholesale distributor in 2011.
Costs and Expenses
The total cost of services and products was $113.0 million in 2012, a decrease of $21.2 million compared to
2011. This decrease was primarily due to $9.0 million of lower network related costs resulting from renegotiated
roaming rates with other wireless carriers, lower network access expenses due to a reduced subscriber base, and
the continued impact of the Company’s cost containment efforts. Cost of goods sold decreased by an additional
$9.0 million over the prior year, driven largely by the impact of fewer sales of wireless handsets and related
accessories. In addition, contract services and other costs of providing service decreased by $3.1 million year-
over-year due largely to the Company’s cost containment efforts which led to reduced call center, network
software and cell site maintenance expenses.
SG&A expense in 2012 decreased by $11.5 million year-over-year to $43.7 million, largely reflecting the
impact of cost containment initiatives combined with a $2.8 million reduction in bad debt expense. The closing
of three retail stores and associated headcount reductions in 2012 resulted in lower payroll costs of $2.5 million
compared to the prior year, while other selling and marketing expenses and advertising expenses also decreased
by $2.1 million and $1.7 million, respectively, driven by the Company’s cost containment efforts.
Depreciation and amortization was $31.9 million in 2012, a decrease of $1.6 million from 2011 due largely
to the closing of three retail stores in 2012.
Restructuring charges of $1.6 million incurred in 2012 were related to employee separation costs as well as
lease abandonments from the closing of the three retail stores in 2012. In 2011, no restructuring charges were
recognized.
In 2011, Wireless recognized a goodwill impairment loss of $50.3 million that resulted from declines in the
segment’s revenue and wireless subscribers. In 2012 and 2011, other asset impairments were $0.4 million and
$1.1 million, respectively, related to the write-off of canceled or abandoned capital projects.
Capital Expenditures
Capital expenditures were $15.8 million in 2012 as the Company continues to support increasing data usage
on its network.
40
Form 10-K Part II Cincinnati Bell Inc.