Cincinnati Bell 2013 Annual Report Download - page 123
Download and view the complete annual report
Please find page 123 of the 2013 Cincinnati Bell annual report below. You can navigate through the pages in the report by either clicking on the pages listed below, or by using the keyword search tool below to find specific information within the annual report.-
 1
1 -
2
-
3
-
4
-
5
-
6
-
7
-
8
-
9
-
10
-
11
-
12
-
13
-
14
-
15
-
16
-
17
-
18
-
19
-
20
-
21
-
22
-
23
-
24
-
25
-
26
-
27
-
28
-
29
-
30
-
31
-
32
-
33
-
34
-
35
-
36
-
37
-
38
-
39
-
40
-
41
-
42
-
43
-
44
-
45
-
46
-
47
-
48
-
49
-
50
-
51
-
52
-
53
-
54
-
55
-
56
-
57
-
58
-
59
-
60
-
61
-
62
-
63
-
64
-
65
-
66
-
67
-
68
-
69
-
70
-
71
-
72
-
73
-
74
-
75
-
76
-
77
-
78
-
79
-
80
-
81
-
82
-
83
-
84
-
85
-
86
-
87
-
88
-
89
-
90
-
91
-
92
-
93
-
94
-
95
-
96
-
97
-
98
-
99
-
100
-
101
-
102
-
103
-
104
-
105
-
106
-
107
-
108
-
109
-
110
-
111
-
112
-
 113
113 -
 114
114 -
 115
115 -
 116
116 -
 117
117 -
 118
118 -
 119
119 -
 120
120 -
 121
121 -
 122
122 -
 123
123 -
 124
124 -
 125
125 -
 126
126 -
 127
127 -
 128
128 -
 129
129 -
 130
130 -
 131
131 -
 132
132 -
 133
133 -
134
-
135
-
136
-
137
-
138
-
139
-
140
-
141
-
142
-
143
-
144
-
145
-
146
-
147
-
148
-
149
-
150
-
151
-
152
-
153
-
154
-
155
-
156
-
157
-
158
-
159
-
160
-
161
-
162
-
163
-
164
-
165
-
166
-
167
-
168
-
169
-
170
-
171
-
172
-
173
-
174
-
175
-
176
-
177
-
178
-
179
-
180
-
181
-
182
-
183
-
184
-
185
-
186
-
187
-
188
-
189
-
190
-
191
-
192
-
193
-
194
-
195
-
196
-
197
-
198
-
199
-
200
-
201
-
202
-
203
-
204
-
205
-
206
-
207
-
208
-
209
-
210
-
211
-
212
-
213
-
214
-
215
-
216
-
217
-
218
-
219
-
220
-
221
-
222
-
223
-
224
-
225
-
226
-
227
-
228
-
229
-
230
-
231
-
232
-
233
-
234
-
235
-
236
-
237
-
238
-
239
-
240
-
241
-
242
-
243
-
244
-
245
-
246
-
247
-
248
-
249
-
250
-
251
-
252
-
253
-
254
-
255
-
256
-
257
-
258
-
259
-
260
-
261
-
262
-
263
-
264
-
265
-
266
-
267
-
268
-
269
-
270
-
271
-
272
-
273
-
274
-
275
-
276
-
277
-
278
-
279
-
280
-
281
-
282
-
283
-
284
-
285
-
286
-
287
-
288
-
289
-
290
-
291
-
292
 |
 |
Form 10-K Part II Cincinnati Bell Inc.
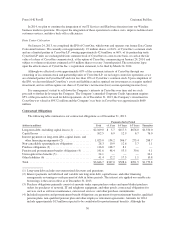
Data Center Colocation
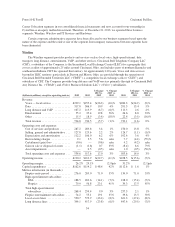
The Data Center Colocation segment provided enterprise customers with outsourced data center operations,
including necessary redundancy, security, power, cooling, and interconnection. For the year ended December 31,
2013, revenues and expenses represent revenues earned and operating expenses incurred during the period
January 1, 2013 to January 23, 2013 when CyrusOne’s results were included in our consolidated financial
statements. Upon completion of the IPO of CyrusOne on January 24, 2013, we no longer control the operations
of CyrusOne and now account for our investment in CyrusOne using the equity method.
(dollars in millions, except for operating metrics) 2013 2012
$ Change
2013 vs.
2012
% Change
2013 vs.
2012 2011
$ Change
2012 vs.
2011
% Change
2012 vs.
2011
Revenue ........................... $15.6 $221.3 $(205.7) n/m $184.7 $ 36.6 20%
Operating costs and expenses:
Cost of services ................... 4.8 75.7 (70.9) n/m 59.7 16.0 27%
Selling, general and administrative .... 2.4 31.0 (28.6) n/m 23.8 7.2 30%
Depreciation and amortization ....... 5.2 70.6 (65.4) n/m 54.8 15.8 29%
Restructuring charges .............. — 0.5 (0.5) n/m — 0.5 n/m
Gain on sale of assets .............. — (0.2) 0.2 n/m — (0.2) n/m
Asset impairments ................. — 13.3 (13.3) n/m — 13.3 n/m
Total operating costs and expenses .... 12.4 190.9 (178.5) n/m 138.3 52.6 38%
Operating income ................... $ 3.2 $ 30.4 $ (27.2) n/m $ 46.4 $ (16.0) (34)%
Operating margin .................... 20.5% 13.7% n/m 25.1% (11.4)pts
Capital expenditures ................. $ 7.7 $228.2 $(220.5) n/m $118.5 $109.7 93%
2013 Compared to 2012
Data Center Colocation revenues, operating expenses and operating income for 2013 are not comparable to
2012 as we no longer include CyrusOne’s results in our consolidated financial statements after the completion of
its IPO on January 24, 2013.
2012 Compared to 2011
Revenue
Data center service revenue consisted of recurring colocation rents and nonrecurring revenue for installation
of customer equipment. Data center revenue was $221.3 million in 2012, up $36.6 million, or 20%, compared to
2011 primarily due to sales of additional space, power, and related colocation products to new and existing
customers.
Our data center capacity increased to 932,000 square feet at December 31, 2012, a net increase of 22%
compared to the same period in 2011. During 2012, we completed construction on 199,000 square feet of new
data center capacity but also decommissioned 30,000 square feet of old, low-value legacy space in the Cincinnati
market, resulting in a net increase in capacity of 169,000 square feet. The amount of new space contractually
committed to customers totaled 92,000 square feet in 2012. As a result, the utilization rate of the data center
facilities was 78% at December 31, 2012, down from 88% in the prior year. Of the 199,000 square feet of new
capacity added during 2012, 66% was completed and commissioned during the second half of 2012.
Costs and Expenses
Cost of services in 2012 of $75.7 million increased by $16.0 million compared to 2011. Substantially all
property operating costs increased as a result of the expansion of our data center facilities. Payroll, electricity,
contract services, rent and property taxes all increased as additional data center space was commissioned for
service.
43
Form 10-K