Cincinnati Bell 2013 Annual Report Download - page 281
Download and view the complete annual report
Please find page 281 of the 2013 Cincinnati Bell annual report below. You can navigate through the pages in the report by either clicking on the pages listed below, or by using the keyword search tool below to find specific information within the annual report.-
 1
1 -
2
-
3
-
4
-
5
-
6
-
7
-
8
-
9
-
10
-
11
-
12
-
13
-
14
-
15
-
16
-
17
-
18
-
19
-
20
-
21
-
22
-
23
-
24
-
25
-
26
-
27
-
28
-
29
-
30
-
31
-
32
-
33
-
34
-
35
-
36
-
37
-
38
-
39
-
40
-
41
-
42
-
43
-
44
-
45
-
46
-
47
-
48
-
49
-
50
-
51
-
52
-
53
-
54
-
55
-
56
-
57
-
58
-
59
-
60
-
61
-
62
-
63
-
64
-
65
-
66
-
67
-
68
-
69
-
70
-
71
-
72
-
73
-
74
-
75
-
76
-
77
-
78
-
79
-
80
-
81
-
82
-
83
-
84
-
85
-
86
-
87
-
88
-
89
-
90
-
91
-
92
-
93
-
94
-
95
-
96
-
97
-
98
-
99
-
100
-
101
-
102
-
103
-
104
-
105
-
106
-
107
-
108
-
109
-
110
-
111
-
112
-
113
-
114
-
115
-
116
-
117
-
118
-
119
-
120
-
121
-
122
-
123
-
124
-
125
-
126
-
127
-
128
-
129
-
130
-
131
-
132
-
133
-
134
-
135
-
136
-
137
-
138
-
139
-
140
-
141
-
142
-
143
-
144
-
145
-
146
-
147
-
148
-
149
-
150
-
151
-
152
-
153
-
154
-
155
-
156
-
157
-
158
-
159
-
160
-
161
-
162
-
163
-
164
-
165
-
166
-
167
-
168
-
169
-
170
-
171
-
172
-
173
-
174
-
175
-
176
-
177
-
178
-
179
-
180
-
181
-
182
-
183
-
184
-
185
-
186
-
187
-
188
-
189
-
190
-
191
-
192
-
193
-
194
-
195
-
196
-
197
-
198
-
199
-
200
-
201
-
202
-
203
-
204
-
205
-
206
-
207
-
208
-
209
-
210
-
211
-
212
-
213
-
214
-
215
-
216
-
217
-
218
-
219
-
220
-
221
-
222
-
223
-
224
-
225
-
226
-
227
-
228
-
229
-
230
-
231
-
232
-
233
-
234
-
235
-
236
-
237
-
238
-
239
-
240
-
241
-
242
-
243
-
244
-
245
-
246
-
247
-
248
-
249
-
250
-
251
-
252
-
253
-
254
-
255
-
256
-
257
-
258
-
259
-
260
-
261
-
262
-
263
-
264
-
265
-
266
-
267
-
268
-
269
-
270
-
 271
271 -
 272
272 -
 273
273 -
 274
274 -
 275
275 -
 276
276 -
 277
277 -
 278
278 -
 279
279 -
 280
280 -
 281
281 -
 282
282 -
 283
283 -
 284
284 -
 285
285 -
 286
286 -
 287
287 -
 288
288 -
 289
289 -
 290
290 -
 291
291 -
292
 |
 |

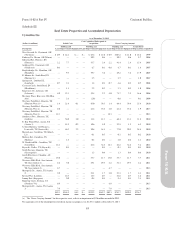
Form 10-K/A Part IV Cincinnati Bell Inc.
Schedule III.
Real Estate Properties and Accumulated Depreciation
CyrusOne Inc.
As of December 31, 2013
(dollars in millions) Initial Costs
Cost Capitalized Subsequent to
Acquisition Gross Carrying Amount
Description Land
Building and
Improvements Equipment Land
Building and
Improvements Equipment Land
Building and
Improvements Equipment
Accumulated
Depreciation Acquisition
West Seventh St., Cincinnati, OH
(7th Street) ...................$ 0.9 $ 42.2 $ — $— $ 65.4 $ 11.0 $ 0.9 $107.6 $ 11.0 $ 63.6 1999
Parkway Dr., Mason, OH (Mason) . . — — — — 20.2 0.6 — 20.2 0.6 9.7 2004
Industrial Rd., Florence, KY
(Florence) ................... 2.2 7.7 — — 33.7 2.4 2.2 41.4 2.4 15.4 2005
Goldcoast Dr., Cincinnati, OH
(Goldcoast) .................. 0.6 — — — 6.7 0.1 0.6 6.7 0.1 1.8 2007
Knightsbridge Dr., Hamilton, OH
(Hamilton) ................... — 9.5 — — 39.7 3.6 — 49.2 3.6 17.9 2007
E. Monroe St., South Bend, IN
(Monroe St.) ................. — — — — 2.5 — — 2.5 — 1.0 2007
Springer St., Lombard, IL
(Lombard) ................... 0.7 3.2 — — 1.4 0.2 0.7 4.6 0.2 0.5 2008
Crescent Circle, South Bend, IN
(Blackthorn) .................. — 1.1 — — 2.2 0.2 — 3.3 0.2 1.0 2008
Kingsview Dr., Lebanon, OH
(Lebanon) ................... 4.0 12.3 — — 59.4 2.2 4.0 71.7 2.2 16.6 2008
McAuley Place, Blue Ash, OH (Blue
Ash) ........................ — 2.6 — — (2.0) — — 0.6 — 0.1 2009
Westway Park Blvd., Houston, TX
(Houston West 1)(a) ............ 1.4 21.4 0.1 — 63.0 39.3 1.4 84.4 39.4 25.4 2010
Westway Park Blvd., Houston, TX
(Houston West 2) .............. 2.0 — — — 22.4 15.8 2.0 22.4 15.8 1.9 2013
Westway Park Blvd., Houston, TX
(Houston West 3) .............. 18.3 — — — — — 18.3 — — — 2013
Southwest Fwy., Houston, TX
(Galleria) .................... — 56.0 2.0 — 12.4 11.3 — 68.4 13.3 21.8 2010
E. Ben White Blvd., Austin, TX
(Austin 1) .................... — 11.9 0.2 — 10.6 1.0 — 22.5 1.2 6.3 2010
S. State Highway 121 Business,
Lewisville, TX (Lewisville) ..... — 46.2 2.2 — 30.8 18.1 — 77.0 20.3 28.4 2010
Marsh Lane, Carrollton, TX (Marsh
Ln) ......................... — — — — 0.1 0.5 — 0.1 0.5 0.2 2010
Midway Rd., Carrollton, TX
(Midway) .................... — 1.8 — — 0.2 0.4 — 2.0 0.4 2.1 2010
W. Frankford Rd., Carrollton, TX
(Carrollton) .................. 16.1 — — — 42.6 34.8 16.1 42.6 34.8 5.2 2012
Bryan St., Dallas, TX (Bryan St) . . . — 0.1 — — — 0.1 — 0.1 0.1 0.1 2010
North Freeway, Houston, TX
(Greenspoint) ................. — — — — 1.3 0.4 — 1.3 0.4 0.8 2010
South Ellis Street, Chandler, AZ
(Phoenix) .................... 15.0 — — — 55.7 11.7 15.0 55.7 11.7 3.7 2011
Westover Hills Blvd., San Antonio,
TX (San Antonio 1) ............ 4.6 3.0 — — 29.1 29.5 4.6 32.1 29.5 4.2 2011
Westover Hills Blvd., San Antonio,
TX (San Antonio 2) ............ 6.7 — — — — — 6.7 — — — 2013
Metropolis Dr., Austin, TX (Austin
2) .......................... 2.0 — — — 23.1 1.7 2.0 23.1 1.7 4.3 2011
Kestral Way (London) ............ — 16.5 — — 18.3 0.7 — 34.8 0.7 2.6 2011
Jurong East (Singapore) .......... — 9.0 — — 0.4 0.1 — 9.4 0.1 2.1 2011
Ridgetop Circle, Sterling, VA
(Northern VA) ................ 6.9 — — — — — 6.9 — — — 2013
Metropolis Dr., Austin, TX (Austin
3) .......................... 7.9 — — — — — 7.9 — — — 2013
$89.3 $244.5 $4.5 $— $539.2 $185.7 $89.3 $783.7 $190.2 $236.7
(a) The “Gross Carrying Amount” for this respective asset, reflects an impairment of $2.8 million recorded in 2013.
The aggregate cost of the total properties for federal income tax purposes was $1,491.7 million at December 31, 2013.
63
Form 10-K/A