Cincinnati Bell 2013 Annual Report Download - page 199
Download and view the complete annual report
Please find page 199 of the 2013 Cincinnati Bell annual report below. You can navigate through the pages in the report by either clicking on the pages listed below, or by using the keyword search tool below to find specific information within the annual report.-
 1
1 -
2
-
3
-
4
-
5
-
6
-
7
-
8
-
9
-
10
-
11
-
12
-
13
-
14
-
15
-
16
-
17
-
18
-
19
-
20
-
21
-
22
-
23
-
24
-
25
-
26
-
27
-
28
-
29
-
30
-
31
-
32
-
33
-
34
-
35
-
36
-
37
-
38
-
39
-
40
-
41
-
42
-
43
-
44
-
45
-
46
-
47
-
48
-
49
-
50
-
51
-
52
-
53
-
54
-
55
-
56
-
57
-
58
-
59
-
60
-
61
-
62
-
63
-
64
-
65
-
66
-
67
-
68
-
69
-
70
-
71
-
72
-
73
-
74
-
75
-
76
-
77
-
78
-
79
-
80
-
81
-
82
-
83
-
84
-
85
-
86
-
87
-
88
-
89
-
90
-
91
-
92
-
93
-
94
-
95
-
96
-
97
-
98
-
99
-
100
-
101
-
102
-
103
-
104
-
105
-
106
-
107
-
108
-
109
-
110
-
111
-
112
-
113
-
114
-
115
-
116
-
117
-
118
-
119
-
120
-
121
-
122
-
123
-
124
-
125
-
126
-
127
-
128
-
129
-
130
-
131
-
132
-
133
-
134
-
135
-
136
-
137
-
138
-
139
-
140
-
141
-
142
-
143
-
144
-
145
-
146
-
147
-
148
-
149
-
150
-
151
-
152
-
153
-
154
-
155
-
156
-
157
-
158
-
159
-
160
-
161
-
162
-
163
-
164
-
165
-
166
-
167
-
168
-
169
-
170
-
171
-
172
-
173
-
174
-
175
-
176
-
177
-
178
-
179
-
180
-
181
-
182
-
183
-
184
-
185
-
186
-
187
-
188
-
 189
189 -
 190
190 -
 191
191 -
 192
192 -
 193
193 -
 194
194 -
 195
195 -
 196
196 -
 197
197 -
 198
198 -
 199
199 -
 200
200 -
 201
201 -
 202
202 -
 203
203 -
 204
204 -
 205
205 -
 206
206 -
 207
207 -
 208
208 -
 209
209 -
210
-
211
-
212
-
213
-
214
-
215
-
216
-
217
-
218
-
219
-
220
-
221
-
222
-
223
-
224
-
225
-
226
-
227
-
228
-
229
-
230
-
231
-
232
-
233
-
234
-
235
-
236
-
237
-
238
-
239
-
240
-
241
-
242
-
243
-
244
-
245
-
246
-
247
-
248
-
249
-
250
-
251
-
252
-
253
-
254
-
255
-
256
-
257
-
258
-
259
-
260
-
261
-
262
-
263
-
264
-
265
-
266
-
267
-
268
-
269
-
270
-
271
-
272
-
273
-
274
-
275
-
276
-
277
-
278
-
279
-
280
-
281
-
282
-
283
-
284
-
285
-
286
-
287
-
288
-
289
-
290
-
291
-
292
 |
 |

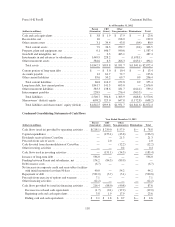
Form 10-K Part II Cincinnati Bell Inc.
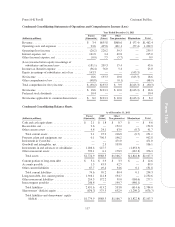
Year Ended December 31, 2012
(dollars in millions)
Parent
(Guarantor)
CBT
(Issuer)
Other
Non-guarantors Eliminations Total
Cash flows (used in) provided by operating activities . . . $(144.8) $ 250.4 $ 107.1 $— $ 212.7
Capital expenditures ............................. — (108.8) (258.4) — (367.2)
Proceeds from sale of assets ....................... — 1.4 0.2 — 1.6
Other investing activities ......................... — — (6.2) — (6.2)
Cash flows used in investing activities ............... — (107.4) (264.4) — (371.8)
Issuance of long-term debt ........................ — — 525.0 — 525.0
Funding between Parent and subsidiaries, net ......... 433.6 (66.0) (367.6) — —
Net increase in corporate credit and receivables facilities
with initial maturities less than 90 days ............ — — 52.0 — 52.0
Repayment of debt .............................. (352.0) (76.5) (13.9) — (442.4)
Debt issuance costs .............................. (3.6) — (17.3) — (20.9)
Common stock issuance costs ..................... — — (5.7) — (5.7)
Common stock repurchase ........................ (0.3) — — — (0.3)
Proceeds from exercise of options and warrants ....... 12.1 — — — 12.1
Other financing activities ......................... (10.8) — — — (10.8)
Cash flows provided by (used in) financing activities . . . 79.0 (142.5) 172.5 — 109.0
(Decrease) increase in cash and cash equivalents .... (65.8) 0.5 15.2 — (50.1)
Beginning cash and cash equivalents .............. 69.6 1.4 2.7 — 73.7
Ending cash and cash equivalents ................ $ 3.8 $ 1.9 $ 17.9 $— $ 23.6
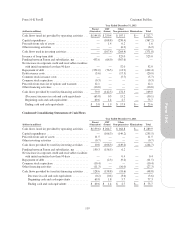
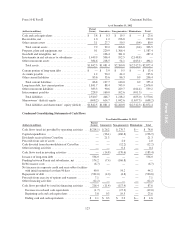
Condensed Consolidating Statements of Cash Flows
Year Ended December 31, 2011
(dollars in millions)
Parent
(Guarantor)
CBT
(Issuer)
Other
Non-guarantors Eliminations Total
Cash flows (used in) provided by operating activities . . . $(139.6) $ 264.7 $ 164.8 $— $ 289.9
Capital expenditures ............................. — (106.3) (149.2) — (255.5)
Proceeds from sale of assets ....................... 11.5 — — — 11.5
Other investing activities ......................... (0.7) — — — (0.7)
Cash flows provided by (used in) investing activities . . . 10.8 (106.3) (149.2) — (244.7)
Funding between Parent and subsidiaries, net ......... 150.3 (156.5) 6.2 — —
Net increase in corporate credit and receivables facilities
with initial maturities less than 90 days ............ — — 0.4 — 0.4
Repayment of debt .............................. — (2.3) (9.2) — (11.5)
Common stock repurchase ........................ (10.4) — — — (10.4)
Other financing activities ......................... (11.3) — (16.0) — (27.3)
Cash flows provided by (used in) financing activities . . . 128.6 (158.8) (18.6) — (48.8)
Decrease in cash and cash equivalents ........... (0.2) (0.4) (3.0) — (3.6)
Beginning cash and cash equivalents ............ 69.8 1.8 5.7 — 77.3
Ending cash and cash equivalents .............. $ 69.6 $ 1.4 $ 2.7 $— $ 73.7
119
Form 10-K