Cincinnati Bell 2013 Annual Report Download - page 110
Download and view the complete annual report
Please find page 110 of the 2013 Cincinnati Bell annual report below. You can navigate through the pages in the report by either clicking on the pages listed below, or by using the keyword search tool below to find specific information within the annual report.-
 1
1 -
2
-
3
-
4
-
5
-
6
-
7
-
8
-
9
-
10
-
11
-
12
-
13
-
14
-
15
-
16
-
17
-
18
-
19
-
20
-
21
-
22
-
23
-
24
-
25
-
26
-
27
-
28
-
29
-
30
-
31
-
32
-
33
-
34
-
35
-
36
-
37
-
38
-
39
-
40
-
41
-
42
-
43
-
44
-
45
-
46
-
47
-
48
-
49
-
50
-
51
-
52
-
53
-
54
-
55
-
56
-
57
-
58
-
59
-
60
-
61
-
62
-
63
-
64
-
65
-
66
-
67
-
68
-
69
-
70
-
71
-
72
-
73
-
74
-
75
-
76
-
77
-
78
-
79
-
80
-
81
-
82
-
83
-
84
-
85
-
86
-
87
-
88
-
89
-
90
-
91
-
92
-
93
-
94
-
95
-
96
-
97
-
98
-
99
-
 100
100 -
 101
101 -
 102
102 -
 103
103 -
 104
104 -
 105
105 -
 106
106 -
 107
107 -
 108
108 -
 109
109 -
 110
110 -
 111
111 -
 112
112 -
 113
113 -
 114
114 -
 115
115 -
 116
116 -
 117
117 -
 118
118 -
 119
119 -
 120
120 -
121
-
122
-
123
-
124
-
125
-
126
-
127
-
128
-
129
-
130
-
131
-
132
-
133
-
134
-
135
-
136
-
137
-
138
-
139
-
140
-
141
-
142
-
143
-
144
-
145
-
146
-
147
-
148
-
149
-
150
-
151
-
152
-
153
-
154
-
155
-
156
-
157
-
158
-
159
-
160
-
161
-
162
-
163
-
164
-
165
-
166
-
167
-
168
-
169
-
170
-
171
-
172
-
173
-
174
-
175
-
176
-
177
-
178
-
179
-
180
-
181
-
182
-
183
-
184
-
185
-
186
-
187
-
188
-
189
-
190
-
191
-
192
-
193
-
194
-
195
-
196
-
197
-
198
-
199
-
200
-
201
-
202
-
203
-
204
-
205
-
206
-
207
-
208
-
209
-
210
-
211
-
212
-
213
-
214
-
215
-
216
-
217
-
218
-
219
-
220
-
221
-
222
-
223
-
224
-
225
-
226
-
227
-
228
-
229
-
230
-
231
-
232
-
233
-
234
-
235
-
236
-
237
-
238
-
239
-
240
-
241
-
242
-
243
-
244
-
245
-
246
-
247
-
248
-
249
-
250
-
251
-
252
-
253
-
254
-
255
-
256
-
257
-
258
-
259
-
260
-
261
-
262
-
263
-
264
-
265
-
266
-
267
-
268
-
269
-
270
-
271
-
272
-
273
-
274
-
275
-
276
-
277
-
278
-
279
-
280
-
281
-
282
-
283
-
284
-
285
-
286
-
287
-
288
-
289
-
290
-
291
-
292
 |
 |
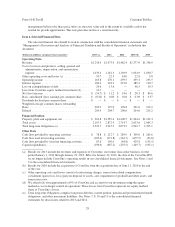
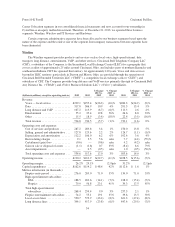
Product revenue totaled $217.6 million in 2013, up 8%, compared to 2012. The increase was largely due to
a $17.9 million increase in sales of telecommunications and IT hardware. These increases were partially offset by
slight declines in both Wireline and Wireless product revenue.
Cost of services was $427.1 million in 2013, compared to $489.9 million in 2012, which included CyrusOne
costs of services totaling $73.0 million. Excluding CyrusOne, cost of services increased year-over-year primarily
to support the growth in Fioptics and managed and professional services. Wireline cost of services was up $7.5
million compared to the prior year and IT Services and Hardware costs were up $8.9 million. Wireless cost of
services was down $10.8 million as a result of a declining subscriber base.
Cost of products sold was $215.9 million in 2013 compared to $204.7 million in the prior year, an increase
of $11.2 million due to a $16.9 million increase as a result of higher telecommunications and IT hardware sales.
Wireline and Wireless cost of products sold were down $2.6 million and $3.1 million, respectively, compared to
the prior year.
Selling, general and administrative (“SG&A”) expenses were $220.8 million in 2013, a decrease of $48.7
million, or 18%, compared to 2012. The decrease is partially the result of no longer consolidating CyrusOne, which
accounted for $28.5 million of the decrease. Corporate costs were down $20.7 million from the prior year, primarily
as a result of recognizing a $5.6 million stock compensation mark-to-market gain in 2013 compared to a $7.9
million stock compensation mark-to-market expense in 2012. The remaining decrease is due to a $4.7 million
decrease in bonus expense and a $2.5 million decrease in payroll and other headcount related costs as a result of
cost-out initiatives. Wireline and IT Services and Hardware SG&A expenses were up $1.1 and $2.4 million,
respectively, primarily to support the growth of our strategic products. Wireless SG&A expenses were down $3.0
million as a result of cost-out initiatives as we focus on operating the segment for cash flow and profitability.
Depreciation and amortization was $169.6 million in 2013, a decrease of $47.8 million compared to the
prior year, primarily due to the deconsolidation of CyrusOne. In 2012, CyrusOne’s depreciation and amortization
expense totaled $70.6 million compared to $5.2 million in 2013. Wireline depreciation and amortization
increased by $6.2 million due to the expansion of Fioptics and our fiber-based network. IT Services and
Hardware was $1.9 million higher than the prior year as a result of new assets placed in service to support growth
in managed and professional service revenue. Wireless depreciation and amortization expense totaled $41.2
million in 2013, up $9.3 million compared to the prior year. In the first quarter of 2013, the useful lives assigned
to network software was shortened resulting in $8.5 million of higher depreciation charges. In the fourth quarter
of 2013, the remaining useful life for all property, plant and equipment, and finite-lived intangible assets was
reduced to 30 months as of December 31, 2013. This change in estimate resulted in additional depreciation and
amortization expense of $3.0 million in the fourth quarter and is expected to increase depreciation expense by
approximately $36 million in 2014. The useful life change in the fourth quarter of 2013 also resulted in the
acceleration of the deferred gain associated with the 2009 tower sale. In 2013, the amortization of the deferred
gain associated with the tower sale totaled $3.3 million, compared to approximately $14 million expected to be
recognized in 2014.
Restructuring charges were $13.7 million in 2013 compared to $3.4 million in the prior year. In 2013,
restructuring charges represented severance associated with employee separations, consulting fees related to a
workforce optimization initiatives and lease abandonments. Employee severance costs associated with the
Wireline and IT Services segment are related to workforce initiatives associated with the continued integration of
the Wireline business market with the IT Services and Hardware segment. Corporate employee severance costs
were associated with the consulting fees and cost-out initiatives as a result of our smaller size due to the IPO of
CyrusOne. Lease abandonment costs for the Wireline segment totaled $3.9 million as we consolidated office
space. The Wireless segment recorded a $0.2 million lease abandonment charge due to the closure of a retail
store. In 2012, restructuring costs were incurred for employee separations totaling $2.5 million primarily related
to Wireline and Wireless. Lease abandonment charges were $0.9 million in 2012.
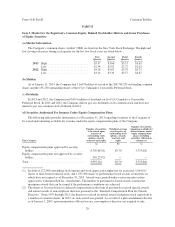
In 2010, the Company’s Board of Directors approved long-term incentive programs for certain members of
management. Payment was contingent upon the completion of a qualifying transaction and attainment of an
increase in the equity value of the data center business, as defined in the plans. On January 24, 2013, the initial
30
Form 10-K Part II Cincinnati Bell Inc.