Cincinnati Bell 2013 Annual Report Download - page 190
Download and view the complete annual report
Please find page 190 of the 2013 Cincinnati Bell annual report below. You can navigate through the pages in the report by either clicking on the pages listed below, or by using the keyword search tool below to find specific information within the annual report.-
 1
1 -
2
-
3
-
4
-
5
-
6
-
7
-
8
-
9
-
10
-
11
-
12
-
13
-
14
-
15
-
16
-
17
-
18
-
19
-
20
-
21
-
22
-
23
-
24
-
25
-
26
-
27
-
28
-
29
-
30
-
31
-
32
-
33
-
34
-
35
-
36
-
37
-
38
-
39
-
40
-
41
-
42
-
43
-
44
-
45
-
46
-
47
-
48
-
49
-
50
-
51
-
52
-
53
-
54
-
55
-
56
-
57
-
58
-
59
-
60
-
61
-
62
-
63
-
64
-
65
-
66
-
67
-
68
-
69
-
70
-
71
-
72
-
73
-
74
-
75
-
76
-
77
-
78
-
79
-
80
-
81
-
82
-
83
-
84
-
85
-
86
-
87
-
88
-
89
-
90
-
91
-
92
-
93
-
94
-
95
-
96
-
97
-
98
-
99
-
100
-
101
-
102
-
103
-
104
-
105
-
106
-
107
-
108
-
109
-
110
-
111
-
112
-
113
-
114
-
115
-
116
-
117
-
118
-
119
-
120
-
121
-
122
-
123
-
124
-
125
-
126
-
127
-
128
-
129
-
130
-
131
-
132
-
133
-
134
-
135
-
136
-
137
-
138
-
139
-
140
-
141
-
142
-
143
-
144
-
145
-
146
-
147
-
148
-
149
-
150
-
151
-
152
-
153
-
154
-
155
-
156
-
157
-
158
-
159
-
160
-
161
-
162
-
163
-
164
-
165
-
166
-
167
-
168
-
169
-
170
-
171
-
172
-
173
-
174
-
175
-
176
-
177
-
178
-
179
-
 180
180 -
 181
181 -
 182
182 -
 183
183 -
 184
184 -
 185
185 -
 186
186 -
 187
187 -
 188
188 -
 189
189 -
 190
190 -
 191
191 -
 192
192 -
 193
193 -
 194
194 -
 195
195 -
 196
196 -
 197
197 -
 198
198 -
 199
199 -
 200
200 -
201
-
202
-
203
-
204
-
205
-
206
-
207
-
208
-
209
-
210
-
211
-
212
-
213
-
214
-
215
-
216
-
217
-
218
-
219
-
220
-
221
-
222
-
223
-
224
-
225
-
226
-
227
-
228
-
229
-
230
-
231
-
232
-
233
-
234
-
235
-
236
-
237
-
238
-
239
-
240
-
241
-
242
-
243
-
244
-
245
-
246
-
247
-
248
-
249
-
250
-
251
-
252
-
253
-
254
-
255
-
256
-
257
-
258
-
259
-
260
-
261
-
262
-
263
-
264
-
265
-
266
-
267
-
268
-
269
-
270
-
271
-
272
-
273
-
274
-
275
-
276
-
277
-
278
-
279
-
280
-
281
-
282
-
283
-
284
-
285
-
286
-
287
-
288
-
289
-
290
-
291
-
292
 |
 |

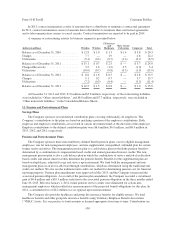
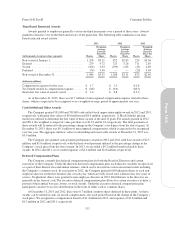
As of December 31, 2013, the aggregate intrinsic value for awards outstanding was approximately $2.2
million and for exercisable awards was $2.1 million. The weighted-average remaining contractual life for awards
outstanding and exercisable are each approximately four years. As of December 31, 2013, there was $0.1 million
of unrecognized stock compensation expense, which is expected to be recognized over a weighted-average period
of approximately one year.
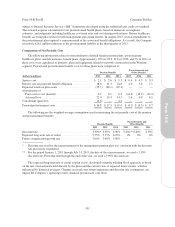
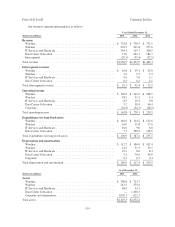
The fair values at the date of grant were estimated using the Black-Scholes pricing model with the following
assumptions:
2013 2012 2011
Expected volatility ......................................................... 43.6% 43.5% —
Risk-free interest rate ....................................................... 0.8% 0.8% —
Expected holding period (in years) ............................................. 5 5 —
Expected dividends ......................................................... 0.0% 0.0% —
Weighted-average grant date fair value ......................................... $1.84 $1.32 $—
The Company did not grant any stock options or stock-settled appreciation rights in the year ended
December 31, 2011. The expected volatility assumption used in the Black-Scholes pricing model was based on
historical volatility. The risk-free interest rate is based on the U.S. Treasury yield curve in effect at the time of
grant. The expected holding period was estimated using the historical exercise behavior of employees and
adjusted for abnormal activity. Expected dividends are based on the Company’s history of not paying dividends.
Performance-Based Restricted Awards
Awards granted generally vest over three years and upon the achievement of certain performance-based
objectives. Performance-based awards are expensed based on their grant date fair value if it is probable that the
performance conditions will be achieved.
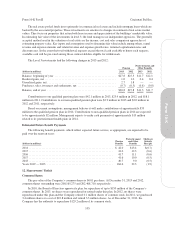
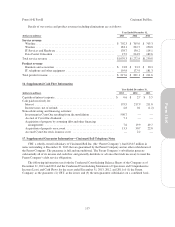
The following table summarizes our outstanding performance-based restricted award activity:
2013 2012 2011
(in thousands, except per share amounts) Shares
Weighted-
Average
Exercise
Price Per
Share Shares
Weighted-
Average
Exercise
Price Per
Share Shares
Weighted-
Average
Exercise
Price Per
Share
Non-vested at January 1, .................... 1,687 $3.13 1,839 $2.90 2,641 $3.25
Granted* ................................. 1,067 4.56 808 3.40 998 2.85
Vested ................................... (703) 3.07 (552) 2.85 (479) 2.84
Forfeited ................................. (514) 3.67 (408) 2.79 (1,321) 3.91
Non-vested at December 31, ................. 1,537 $3.97 1,687 $3.13 1,839 $2.90
(dollars in millions)
Compensation expense for the year ............ $ 2.6 $ 2.7 $ 2.4
Tax benefit related to compensation expense .... $ (1.0) $ (1.0) $ (0.9)
Grant date fair value of awards vested .......... $ 2.2 $ 1.6 $ 1.4
* Assumes the maximum number of awards that can be earned if the performance conditions are achieved.
As of December 31, 2013, unrecognized compensation expense related to performance-based awards was
$1.6 million, which is expected to be recognized over a weighted-average period of approximately two years.
110
Form 10-K Part II Cincinnati Bell Inc.