Cincinnati Bell 2013 Annual Report Download - page 266
Download and view the complete annual report
Please find page 266 of the 2013 Cincinnati Bell annual report below. You can navigate through the pages in the report by either clicking on the pages listed below, or by using the keyword search tool below to find specific information within the annual report.-
 1
1 -
2
-
3
-
4
-
5
-
6
-
7
-
8
-
9
-
10
-
11
-
12
-
13
-
14
-
15
-
16
-
17
-
18
-
19
-
20
-
21
-
22
-
23
-
24
-
25
-
26
-
27
-
28
-
29
-
30
-
31
-
32
-
33
-
34
-
35
-
36
-
37
-
38
-
39
-
40
-
41
-
42
-
43
-
44
-
45
-
46
-
47
-
48
-
49
-
50
-
51
-
52
-
53
-
54
-
55
-
56
-
57
-
58
-
59
-
60
-
61
-
62
-
63
-
64
-
65
-
66
-
67
-
68
-
69
-
70
-
71
-
72
-
73
-
74
-
75
-
76
-
77
-
78
-
79
-
80
-
81
-
82
-
83
-
84
-
85
-
86
-
87
-
88
-
89
-
90
-
91
-
92
-
93
-
94
-
95
-
96
-
97
-
98
-
99
-
100
-
101
-
102
-
103
-
104
-
105
-
106
-
107
-
108
-
109
-
110
-
111
-
112
-
113
-
114
-
115
-
116
-
117
-
118
-
119
-
120
-
121
-
122
-
123
-
124
-
125
-
126
-
127
-
128
-
129
-
130
-
131
-
132
-
133
-
134
-
135
-
136
-
137
-
138
-
139
-
140
-
141
-
142
-
143
-
144
-
145
-
146
-
147
-
148
-
149
-
150
-
151
-
152
-
153
-
154
-
155
-
156
-
157
-
158
-
159
-
160
-
161
-
162
-
163
-
164
-
165
-
166
-
167
-
168
-
169
-
170
-
171
-
172
-
173
-
174
-
175
-
176
-
177
-
178
-
179
-
180
-
181
-
182
-
183
-
184
-
185
-
186
-
187
-
188
-
189
-
190
-
191
-
192
-
193
-
194
-
195
-
196
-
197
-
198
-
199
-
200
-
201
-
202
-
203
-
204
-
205
-
206
-
207
-
208
-
209
-
210
-
211
-
212
-
213
-
214
-
215
-
216
-
217
-
218
-
219
-
220
-
221
-
222
-
223
-
224
-
225
-
226
-
227
-
228
-
229
-
230
-
231
-
232
-
233
-
234
-
235
-
236
-
237
-
238
-
239
-
240
-
241
-
242
-
243
-
244
-
245
-
246
-
247
-
248
-
249
-
250
-
251
-
252
-
253
-
254
-
255
-
 256
256 -
 257
257 -
 258
258 -
 259
259 -
 260
260 -
 261
261 -
 262
262 -
 263
263 -
 264
264 -
 265
265 -
 266
266 -
 267
267 -
 268
268 -
 269
269 -
 270
270 -
 271
271 -
 272
272 -
 273
273 -
 274
274 -
 275
275 -
 276
276 -
277
-
278
-
279
-
280
-
281
-
282
-
283
-
284
-
285
-
286
-
287
-
288
-
289
-
290
-
291
-
292
 |
 |

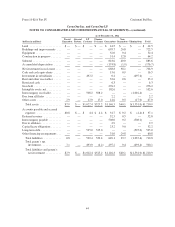
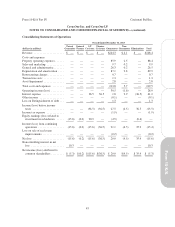
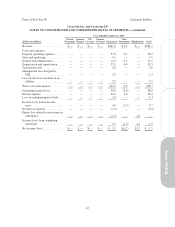
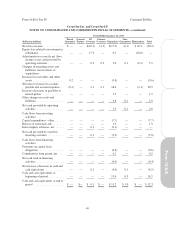
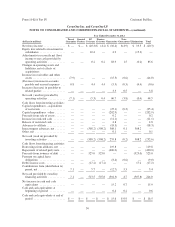
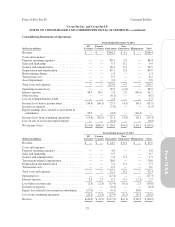
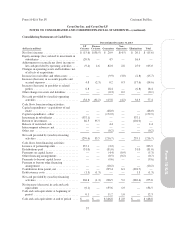
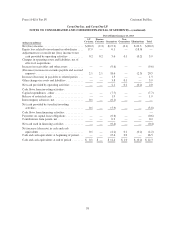
Form 10-K/A Part IV Cincinnati Bell Inc.
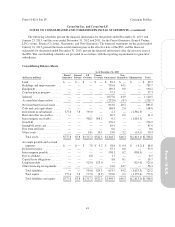
CyrusOne Inc. and CyrusOne LP
NOTES TO CONSOLIDATED AND COMBINED FINANCIAL STATEMENTS—(continued)
Consolidating Statements of Cash Flows
Period Ended December 31, 2013
(dollars in millions)
Parent
Guarantor
General
Partner
LP
Co-issuer
Finance
Co-issuer Guarantors
Non-
Guarantors Eliminations Total
Net (loss) income ............... $ (15.6) (0.2) $ (15.6) $(36.5) 20.9 $(4.5) $ 35.9 $ (15.6)
Equity earnings (loss) related to
investment in subsidiaries ...... 15.6 0.2 (20.9) — 4.5 — 0.6 —
Adjustments to reconcile net (loss)
income to net cash provided by
operating activities ............ (7.1) — (9.4) 4.6 82.0 2.8 32.1 $ 105.0
Changes in operating assets and
liabilities, net of effects of
acquisitions:
Increase in receivables and other
assets ....................... 9.4 — — — (9.9) (3.0) (12.2) $ (15.7)
(Decrease) increase in accounts
payable and accrued expenses . . . (2.3) — 4.8 (2.3) 0.2 0.3 (15.3) $ (14.6)
Increase (decrease) in payables to
related parties ................ — — 6.8 — 18.4 — (6.8) $ 18.4
Other changes in assets and
liabilities .................... — — — — (0.3) 0.2 — $ (0.1)
Net cash (used in) provided by
operating activities ............ — — (34.3) (34.2) 115.8 (4.2) 34.3 77.4
Cash flows from investing activities:
Capital expenditures - acquisitions
of real estate ................. — — — — (48.0) — — (48.0)
Capital expenditures - other ....... — — — — (172.9) — — (172.9)
Investment in subsidiaries ........ (337.1) — (337.1) — — — 674.2 —
Return of investment ............ 31.0 — 66.5 35.5 — — (133.0) —
Release of restricted cash ......... — — — — 4.4 — — 4.4
Intercompany advances, net ....... — — — — — — — —
Other, net ..................... — — — — (0.2) — — (0.2)
Net cash (used in) provided by
investing activities ............ (306.1) — (270.6) 35.5 (216.7) — 541.2 (216.7)
Cash flows from financing activities:
Issuance of common stock/
partnership units .............. 360.5 — 337.1 — — — (337.1) 360.5
IPO costs ...................... (23.4) — — — (3.2) — — (26.6)
Dividends paid ................. (31.0) — (31.0) — (31.0) — 62.0 (31.0)
Payments on capital leases ........ — — — — (4.4) (0.9) — (5.3)
Other financing arrangements ..... — — — — (0.5) (0.2) — (0.7)
Payments to buyout capital leases . . — — — — (9.6) — — (9.6)
Payment to buyout other financing
arrangement ................. — — — — (10.2) — — (10.2)
Contributions from parent
guarantor .................... — — — — 295.4 6.3 (301.7) —
Debt issuance costs .............. — — (1.3) (1.3) — — 1.3 (1.3)
Net cash provided by (used in)
financing activities ............ 306.1 — 304.8 (1.3) 236.5 5.2 (575.5) 275.8
Net (decrease) increase in cash and
cash equivalents .............. — — (0.1) — 135.6 1.0 — 136.5
Cash and cash equivalents at
beginning of period ........... — — 0.1 — 11.2 1.0 — 12.3
Cash and cash equivalents at end of
period ...................... $ — $ — $ — $ — $ 146.8 $ 2.0 $ — $ 148.8
48