Cincinnati Bell 2013 Annual Report Download - page 48
Download and view the complete annual report
Please find page 48 of the 2013 Cincinnati Bell annual report below. You can navigate through the pages in the report by either clicking on the pages listed below, or by using the keyword search tool below to find specific information within the annual report.-
 1
1 -
2
-
3
-
4
-
5
-
6
-
7
-
8
-
9
-
10
-
11
-
12
-
13
-
14
-
15
-
16
-
17
-
18
-
19
-
20
-
21
-
22
-
23
-
24
-
25
-
26
-
27
-
28
-
29
-
30
-
31
-
32
-
33
-
34
-
35
-
36
-
37
-
 38
38 -
 39
39 -
 40
40 -
 41
41 -
 42
42 -
 43
43 -
 44
44 -
 45
45 -
 46
46 -
 47
47 -
 48
48 -
 49
49 -
 50
50 -
 51
51 -
 52
52 -
 53
53 -
 54
54 -
 55
55 -
 56
56 -
 57
57 -
 58
58 -
59
-
60
-
61
-
62
-
63
-
64
-
65
-
66
-
67
-
68
-
69
-
70
-
71
-
72
-
73
-
74
-
75
-
76
-
77
-
78
-
79
-
80
-
81
-
82
-
83
-
84
-
85
-
86
-
87
-
88
-
89
-
90
-
91
-
92
-
93
-
94
-
95
-
96
-
97
-
98
-
99
-
100
-
101
-
102
-
103
-
104
-
105
-
106
-
107
-
108
-
109
-
110
-
111
-
112
-
113
-
114
-
115
-
116
-
117
-
118
-
119
-
120
-
121
-
122
-
123
-
124
-
125
-
126
-
127
-
128
-
129
-
130
-
131
-
132
-
133
-
134
-
135
-
136
-
137
-
138
-
139
-
140
-
141
-
142
-
143
-
144
-
145
-
146
-
147
-
148
-
149
-
150
-
151
-
152
-
153
-
154
-
155
-
156
-
157
-
158
-
159
-
160
-
161
-
162
-
163
-
164
-
165
-
166
-
167
-
168
-
169
-
170
-
171
-
172
-
173
-
174
-
175
-
176
-
177
-
178
-
179
-
180
-
181
-
182
-
183
-
184
-
185
-
186
-
187
-
188
-
189
-
190
-
191
-
192
-
193
-
194
-
195
-
196
-
197
-
198
-
199
-
200
-
201
-
202
-
203
-
204
-
205
-
206
-
207
-
208
-
209
-
210
-
211
-
212
-
213
-
214
-
215
-
216
-
217
-
218
-
219
-
220
-
221
-
222
-
223
-
224
-
225
-
226
-
227
-
228
-
229
-
230
-
231
-
232
-
233
-
234
-
235
-
236
-
237
-
238
-
239
-
240
-
241
-
242
-
243
-
244
-
245
-
246
-
247
-
248
-
249
-
250
-
251
-
252
-
253
-
254
-
255
-
256
-
257
-
258
-
259
-
260
-
261
-
262
-
263
-
264
-
265
-
266
-
267
-
268
-
269
-
270
-
271
-
272
-
273
-
274
-
275
-
276
-
277
-
278
-
279
-
280
-
281
-
282
-
283
-
284
-
285
-
286
-
287
-
288
-
289
-
290
-
291
-
292
 |
 |
Elements of Compensation
Base Salary
Base salaries are provided to the Company’s NEOs for performing their day-to-day responsibilities. The
base salaries of our NEOs are based on a review of the competitive market median for comparable executive
positions, assessment by the Chief Executive Officer (or in the case of the Chief Executive Officer’s base salary,
by the Compensation Committee and entire Board) of the executive’s performance as compared to his or her
individual job responsibilities, the salary level required to attract and retain the executive and such other factors
as the Chief Executive Officer or the Compensation Committee deems relevant for such executive. Generally, no
one factor is given more weight than another, nor does the Company and the Compensation Committee use a
formulaic approach in setting executive pay. Additionally, while the Company looks at 50th percentile total
compensation, it also considers the executive’s individual performance as well in determining salary adjustments.
Because executive pay was adjusted in mid-2012, there were no adjustments in base salary for 2013 for our
NEOs other than in connection with promotions during the year. Mr. Torbeck received a 3% increase upon his
appointment as President and Chief Executive Officer effective January 31, 2013. Effective September 30, 2013,
Mr. Freyberger resigned and, effective October 1, 2013, Mr. Fox was named Chief Financial Officer and was
given a 27% increase in base salary. Effective November 20, 2013, Mr. Heimbach was named Chief Operating
Officer but did not receive an increase in base salary. Mr. Duckworth was given 33% increase in base salary
effective with his promotion to Vice President, Investor Relations and Controller, effective July 9, 2013.
Annual Incentives
Annual incentives are intended to motivate and reward senior executives for achieving the short-term
business objectives of the Company. Annual incentives are payable for the achievement of annual financial
performance goals established by the Compensation Committee and for individual performance. For the NEOs,
financial performance goals represent 80% of the annual incentive determination and individual performance
evaluation represents 20%. Payouts, if any, can range from 0% to 150% of the total target incentive, depending
on the level of achievement of financial goals between threshold and superior levels of performance and
evaluations of individual performance and contributions for the year. The Board and Compensation Committee
approve financial goals annually which reflect their belief that achievement of these goals drives the Company’s
strategic success.
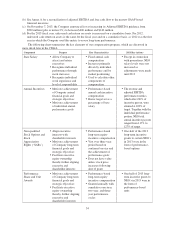
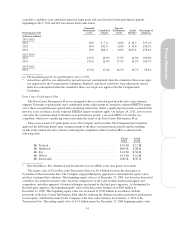
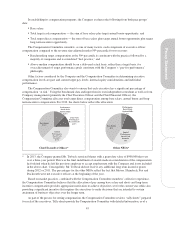
The Company used the following goals having the indicated weights in 2013:
•60% on Adjusted EBITDA;
•20% on revenue; and
•20% on individual performance.
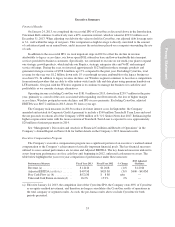
The Company has selected Adjusted EBITDA and revenue as its performance measures. Investors have
identified these metrics as key indicators of current financial performance and the Company’s ability to execute
on its strategy of creating a fiber-based entertainment, communications and IT solutions company with growing
revenue, growing profits and significant cash flows. Adjusted EBITDA is given a significantly higher weighting
than revenue and individual performance because it is a key measure of profitability of the Company that
eliminates the effects of accounting and financing decisions. In addition, investors view it as an effective
barometer of how well a company can service its debt.
The Board and Compensation Committee review and approve the annual bonus attainment percentages for
both adjusted EBITDA and revenue. In conjunction with such review, they may adjust the actual result or goal
amount to reflect a change in business direction, reallocation of Company resources or an unanticipated event.
38