Cincinnati Bell 2013 Annual Report Download - page 40
Download and view the complete annual report
Please find page 40 of the 2013 Cincinnati Bell annual report below. You can navigate through the pages in the report by either clicking on the pages listed below, or by using the keyword search tool below to find specific information within the annual report.-
 1
1 -
2
-
3
-
4
-
5
-
6
-
7
-
8
-
9
-
10
-
11
-
12
-
13
-
14
-
15
-
16
-
17
-
18
-
19
-
20
-
21
-
22
-
23
-
24
-
25
-
26
-
27
-
28
-
29
-
 30
30 -
 31
31 -
 32
32 -
 33
33 -
 34
34 -
 35
35 -
 36
36 -
 37
37 -
 38
38 -
 39
39 -
 40
40 -
 41
41 -
 42
42 -
 43
43 -
 44
44 -
 45
45 -
 46
46 -
 47
47 -
 48
48 -
 49
49 -
 50
50 -
51
-
52
-
53
-
54
-
55
-
56
-
57
-
58
-
59
-
60
-
61
-
62
-
63
-
64
-
65
-
66
-
67
-
68
-
69
-
70
-
71
-
72
-
73
-
74
-
75
-
76
-
77
-
78
-
79
-
80
-
81
-
82
-
83
-
84
-
85
-
86
-
87
-
88
-
89
-
90
-
91
-
92
-
93
-
94
-
95
-
96
-
97
-
98
-
99
-
100
-
101
-
102
-
103
-
104
-
105
-
106
-
107
-
108
-
109
-
110
-
111
-
112
-
113
-
114
-
115
-
116
-
117
-
118
-
119
-
120
-
121
-
122
-
123
-
124
-
125
-
126
-
127
-
128
-
129
-
130
-
131
-
132
-
133
-
134
-
135
-
136
-
137
-
138
-
139
-
140
-
141
-
142
-
143
-
144
-
145
-
146
-
147
-
148
-
149
-
150
-
151
-
152
-
153
-
154
-
155
-
156
-
157
-
158
-
159
-
160
-
161
-
162
-
163
-
164
-
165
-
166
-
167
-
168
-
169
-
170
-
171
-
172
-
173
-
174
-
175
-
176
-
177
-
178
-
179
-
180
-
181
-
182
-
183
-
184
-
185
-
186
-
187
-
188
-
189
-
190
-
191
-
192
-
193
-
194
-
195
-
196
-
197
-
198
-
199
-
200
-
201
-
202
-
203
-
204
-
205
-
206
-
207
-
208
-
209
-
210
-
211
-
212
-
213
-
214
-
215
-
216
-
217
-
218
-
219
-
220
-
221
-
222
-
223
-
224
-
225
-
226
-
227
-
228
-
229
-
230
-
231
-
232
-
233
-
234
-
235
-
236
-
237
-
238
-
239
-
240
-
241
-
242
-
243
-
244
-
245
-
246
-
247
-
248
-
249
-
250
-
251
-
252
-
253
-
254
-
255
-
256
-
257
-
258
-
259
-
260
-
261
-
262
-
263
-
264
-
265
-
266
-
267
-
268
-
269
-
270
-
271
-
272
-
273
-
274
-
275
-
276
-
277
-
278
-
279
-
280
-
281
-
282
-
283
-
284
-
285
-
286
-
287
-
288
-
289
-
290
-
291
-
292
 |
 |
center business as measured against a baseline value on December 31, 2009. In the event of a qualifying
transaction, the value of the data center business on the date of the transaction would be compared to the baseline
value to determine the amount of value created. A more complete description of the Data Center Performance
Plan has been included in the Compensation Discussion and Analysis section of the Company’s 2011, 2012 and
2013 annual proxy statements. In 2013, more than 84% of the shares voted with respect to the Company’s say-
on-pay proposal voted “for” approval of the Company’s executive compensation.
Mr. Cassidy was excluded from participation in the above-referenced Data Center Performance Plan to
ensure that any recommendation he might make to the Board with respect to a potential transaction involving the
data center business would be objective and not motivated by personal interest. However, the Compensation
Committee and the Board reserved the discretion to reward Mr. Cassidy after any qualifying transaction was
consummated based on the value realized by the Company and the health of the Company’s remaining
businesses.
To recognize Mr. Cassidy for the success of the Company’s data center strategy, the Board awarded him a
$2 million cash bonus on January 31, 2013 and, after further deliberation and discussion, the Board awarded him
an additional $7 million cash bonus on May 3, 2013. These special bonus payments were intended to recognize
Mr. Cassidy for his leadership in developing and executing the Company’s data center growth strategy, which
culminated in the successful IPO of CyrusOne. As the Board deliberated these special bonus payments, it
considered several factors. First and foremost, the Board considered the total value creation resulting from the
data center strategy. The Board determined that the total equity value created in the data center business from
December 31, 2009 to its closing value on the date of the IPO was approximately $450 million based on an
independent third party appraisal. Second, the Board took into consideration the fact that Mr. Cassidy was elected
Chairman of CyrusOne’s board of directors upon completion of the IPO and that his continued involvement on
the board of CyrusOne as one of the Company’s representatives was highly desirable given the Company’s
significant remaining investment in CyrusOne. Third, to help calibrate Mr. Cassidy’s total bonus, the Board
considered the value of the bonuses paid to the Company’s other senior executives who participated in the Data
Center Performance Plan. Fourth, the Board took into consideration Mr. Cassidy’s direct involvement in
identifying and developing Mr. Torbeck as his successor and otherwise facilitating the Board’s CEO succession
plan. Fifth, the Board considered the strong leadership and numerous contributions made by Mr. Cassidy during
his 17-year career at the Company. Finally, the Board considered the post-IPO health of the Company’s
remaining businesses and concluded that Mr. Cassidy left the Company well-positioned to continue generating
significant shareholder value well into the future.
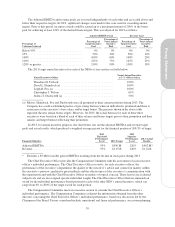
As the Company has continued to execute its emerging business strategy, its incentive plans have also
evolved. In 2012, the Company’s long term incentive performance plan’s metric was changed from free cash
flow to unlevered cash return on average assets (“UCR”). This change was made to increase the focus on how
well the Company’s capital investments are generating appropriate returns. The Compensation Committee
selected this metric because of the importance of ensuring that capital is efficiently deployed as the Company
continues to make substantial investments in its fiber network. Also, beginning in 2014, the Company’s long-
term incentive plan will be further modified to add two additional performance metrics that focus on the need to
drive revenue growth attributable to new products and services (“strategic revenue”) and overall profitability
(“adjusted EBITDA”) over sustained periods. These new metrics will be combined with unlevered cash return on
average assets on an equally weighted basis to ensure a balanced focus on the key drivers of long-term
sustainable shareholder value. In addition, the calculated payout based on these metrics will be further adjusted
by a total shareholder return (“TSR”) modifier at the end of the three-year performance cycle based on the
Company’s TSR performance compared to the Russell 2000. Finally, the Compensation Committee decided to
eliminate interim payments after the first and second years that our prior long-term incentive plan provided such
that the entire payout is based on the full three-year performance period, thereby increasing the focus on long-
term results and creating stronger talent retention impact.
In addition to the above changes, commencing in 2014, the Compensation Committee also made several
other changes to the Company’s compensation policies and practices that demonstrate the Company’s continued
commitment to best practices and a pay-for-performance culture. These changes are detailed below and include
30