Cincinnati Bell 2013 Annual Report Download - page 140
Download and view the complete annual report
Please find page 140 of the 2013 Cincinnati Bell annual report below. You can navigate through the pages in the report by either clicking on the pages listed below, or by using the keyword search tool below to find specific information within the annual report.-
 1
1 -
2
-
3
-
4
-
5
-
6
-
7
-
8
-
9
-
10
-
11
-
12
-
13
-
14
-
15
-
16
-
17
-
18
-
19
-
20
-
21
-
22
-
23
-
24
-
25
-
26
-
27
-
28
-
29
-
30
-
31
-
32
-
33
-
34
-
35
-
36
-
37
-
38
-
39
-
40
-
41
-
42
-
43
-
44
-
45
-
46
-
47
-
48
-
49
-
50
-
51
-
52
-
53
-
54
-
55
-
56
-
57
-
58
-
59
-
60
-
61
-
62
-
63
-
64
-
65
-
66
-
67
-
68
-
69
-
70
-
71
-
72
-
73
-
74
-
75
-
76
-
77
-
78
-
79
-
80
-
81
-
82
-
83
-
84
-
85
-
86
-
87
-
88
-
89
-
90
-
91
-
92
-
93
-
94
-
95
-
96
-
97
-
98
-
99
-
100
-
101
-
102
-
103
-
104
-
105
-
106
-
107
-
108
-
109
-
110
-
111
-
112
-
113
-
114
-
115
-
116
-
117
-
118
-
119
-
120
-
121
-
122
-
123
-
124
-
125
-
126
-
127
-
128
-
129
-
 130
130 -
 131
131 -
 132
132 -
 133
133 -
 134
134 -
 135
135 -
 136
136 -
 137
137 -
 138
138 -
 139
139 -
 140
140 -
 141
141 -
 142
142 -
 143
143 -
 144
144 -
 145
145 -
 146
146 -
 147
147 -
 148
148 -
 149
149 -
 150
150 -
151
-
152
-
153
-
154
-
155
-
156
-
157
-
158
-
159
-
160
-
161
-
162
-
163
-
164
-
165
-
166
-
167
-
168
-
169
-
170
-
171
-
172
-
173
-
174
-
175
-
176
-
177
-
178
-
179
-
180
-
181
-
182
-
183
-
184
-
185
-
186
-
187
-
188
-
189
-
190
-
191
-
192
-
193
-
194
-
195
-
196
-
197
-
198
-
199
-
200
-
201
-
202
-
203
-
204
-
205
-
206
-
207
-
208
-
209
-
210
-
211
-
212
-
213
-
214
-
215
-
216
-
217
-
218
-
219
-
220
-
221
-
222
-
223
-
224
-
225
-
226
-
227
-
228
-
229
-
230
-
231
-
232
-
233
-
234
-
235
-
236
-
237
-
238
-
239
-
240
-
241
-
242
-
243
-
244
-
245
-
246
-
247
-
248
-
249
-
250
-
251
-
252
-
253
-
254
-
255
-
256
-
257
-
258
-
259
-
260
-
261
-
262
-
263
-
264
-
265
-
266
-
267
-
268
-
269
-
270
-
271
-
272
-
273
-
274
-
275
-
276
-
277
-
278
-
279
-
280
-
281
-
282
-
283
-
284
-
285
-
286
-
287
-
288
-
289
-
290
-
291
-
292
 |
 |

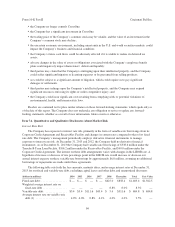
The actuarial assumptions used may differ materially from actual results due to the changing market and
economic conditions and other changes. Revisions to and variations from these estimates would impact assets,
liabilities, equity, cash flow, costs of services and products, and selling, general and administrative expenses.
The following table represents the sensitivity of changes in certain assumptions related to the pension and
postretirement plans as of December 31, 2013:
Pension Benefits Postretirement and Other Benefits
(dollars in millions)
% Point
Change
Increase/
(Decrease) in
Obligation
Increase/
(Decrease) in
Expense
Increase/
(Decrease) in
Obligation
Increase/
(Decrease) in
Expense
Discount rate ......................... +/-0.5% $23.6/($23.6) $0.8/($0.8) $4.2/($3.9) $0.1/(0.1)
Expected return on assets ............... +/-0.5% n/a $1.7/($1.7) n/a $0.1/(0.1)
Healthcare cost trend rate ............... +/-1.0% n/a n/a $4.6/($4.2) $0.2/($0.2)
At December 31, 2013 and 2012, unrecognized actuarial net losses were $284.7 million and $399.8 million,
respectively. The unrecognized net losses have been primarily generated by differences between assumed and
actual rates of return on invested assets, changes in discount rates, and healthcare costs. Because gains and losses
reflect refinements in estimates as well as real changes in economic values and because some gains in one period
may be offset by losses in another or vice versa, we are not required to recognize these gains and losses in the
period that they occur. Instead, if the gains and losses exceed a 10% corridor defined in the accounting literature,
we amortize the excess over the average remaining service period of active employees for the pension and
bargained postretirement plans (approximately 10-14 years) and average life expectancy of retirees for the
management postretirement plan (approximately 16 years).
Accounting for Termination Benefits — The Company has written severance plans covering both its
management and union employees and, as such, accrues probable and estimable employee separation liabilities in
accordance with ASC 712, “Compensation — Nonretirement Postemployment Benefits”. These liabilities are
based on our historical termination rates, historical severance costs, as well as management’s expectation of
future severance events. As of December 31, 2013 and 2012, accrued employee separation liabilities were $9.7
million and $7.8 million, respectively, resulting largely from projected headcount reductions primarily in our
Wireline segment. Further headcount reductions are anticipated in the next few years as we continue to manage
our payroll costs to lower levels.
When employee terminations occur, management also considers the guidance in ASC 715 to determine if
employee terminations give rise to a pension and postretirement curtailment charge. Our accounting policy is that
terminations in a calendar year involving 10% or more of the plan future service years are deemed to be a plan
curtailment.
60
Form 10-K Part II Cincinnati Bell Inc.