Cincinnati Bell 2013 Annual Report Download - page 55
Download and view the complete annual report
Please find page 55 of the 2013 Cincinnati Bell annual report below. You can navigate through the pages in the report by either clicking on the pages listed below, or by using the keyword search tool below to find specific information within the annual report.-
 1
1 -
 2
2 -
 3
3 -
 4
4 -
 5
5 -
 6
6 -
 7
7 -
 8
8 -
 9
9 -
 10
10 -
 11
11 -
 12
12 -
 13
13 -
 14
14 -
 15
15 -
 16
16 -
 17
17 -
 18
18 -
 19
19 -
 20
20 -
 21
21 -
 22
22 -
 23
23 -
 24
24 -
 25
25 -
 26
26 -
 27
27 -
 28
28 -
 29
29 -
 30
30 -
 31
31 -
 32
32 -
 33
33 -
 34
34 -
 35
35 -
 36
36 -
 37
37 -
 38
38 -
 39
39 -
 40
40 -
 41
41 -
 42
42 -
 43
43 -
 44
44 -
 45
45 -
 46
46 -
 47
47 -
 48
48 -
 49
49 -
 50
50 -
 51
51 -
 52
52 -
 53
53 -
 54
54 -
 55
55 -
 56
56 -
 57
57 -
 58
58 -
 59
59 -
 60
60 -
 61
61 -
 62
62 -
 63
63 -
 64
64 -
 65
65 -
 66
66 -
 67
67 -
 68
68 -
 69
69 -
 70
70 -
 71
71 -
 72
72 -
 73
73 -
 74
74 -
 75
75 -
 76
76 -
 77
77 -
 78
78 -
 79
79 -
 80
80 -
 81
81 -
 82
82 -
 83
83 -
 84
84 -
 85
85 -
 86
86 -
 87
87 -
 88
88 -
 89
89 -
 90
90 -
 91
91 -
 92
92 -
 93
93 -
 94
94 -
 95
95 -
 96
96 -
 97
97 -
 98
98 -
 99
99 -
 100
100 -
 101
101 -
 102
102 -
 103
103 -
 104
104 -
 105
105 -
 106
106 -
 107
107 -
 108
108 -
 109
109 -
 110
110 -
 111
111 -
 112
112 -
 113
113 -
 114
114 -
 115
115 -
 116
116 -
 117
117 -
 118
118 -
 119
119 -
 120
120 -
 121
121 -
 122
122 -
 123
123 -
 124
124 -
 125
125 -
 126
126 -
 127
127 -
 128
128 -
 129
129 -
 130
130 -
 131
131 -
 132
132 -
 133
133 -
 134
134 -
 135
135 -
 136
136 -
 137
137 -
 138
138 -
 139
139 -
 140
140 -
 141
141 -
 142
142 -
 143
143 -
 144
144 -
 145
145 -
 146
146 -
 147
147 -
 148
148 -
 149
149 -
 150
150 -
 151
151 -
 152
152 -
 153
153 -
 154
154 -
 155
155 -
 156
156 -
 157
157 -
 158
158 -
 159
159 -
 160
160 -
 161
161 -
 162
162 -
 163
163 -
 164
164 -
 165
165 -
 166
166 -
 167
167 -
 168
168 -
 169
169 -
 170
170 -
 171
171 -
 172
172 -
 173
173 -
 174
174 -
 175
175 -
 176
176 -
 177
177 -
 178
178 -
 179
179 -
 180
180 -
 181
181 -
 182
182 -
 183
183 -
 184
184 -
 185
185 -
 186
186 -
 187
187 -
 188
188 -
 189
189 -
 190
190 -
 191
191 -
 192
192 -
 193
193 -
 194
194 -
 195
195 -
 196
196 -
 197
197 -
 198
198 -
 199
199 -
 200
200 -
 201
201 -
 202
202 -
 203
203 -
 204
204 -
 205
205 -
 206
206 -
 207
207 -
 208
208 -
 209
209 -
 210
210 -
 211
211 -
 212
212 -
 213
213 -
 214
214 -
 215
215 -
 216
216 -
 217
217 -
 218
218 -
 219
219 -
 220
220 -
 221
221 -
 222
222 -
 223
223 -
 224
224 -
 225
225 -
 226
226 -
 227
227 -
 228
228 -
 229
229 -
 230
230 -
 231
231 -
 232
232 -
 233
233 -
 234
234 -
 235
235 -
 236
236 -
 237
237 -
 238
238 -
 239
239 -
 240
240 -
 241
241 -
 242
242 -
 243
243 -
 244
244 -
 245
245 -
 246
246 -
 247
247 -
 248
248 -
 249
249 -
 250
250 -
 251
251 -
 252
252 -
 253
253 -
 254
254 -
 255
255 -
 256
256 -
 257
257 -
 258
258 -
 259
259 -
 260
260 -
 261
261 -
 262
262 -
 263
263 -
 264
264 -
 265
265 -
 266
266 -
 267
267 -
 268
268 -
 269
269 -
 270
270 -
 271
271 -
 272
272 -
 273
273 -
 274
274 -
 275
275 -
 276
276 -
 277
277 -
 278
278 -
 279
279 -
 280
280 -
 281
281 -
 282
282 -
 283
283 -
 284
284 -
 285
285 -
 286
286 -
 287
287 -
 288
288 -
 289
289 -
 290
290 -
 291
291 -
 292
292
 |
 |

In establishing its compensation programs, the Company evaluates the following from both peer groups’
data:
•Base salary;
•Total target cash compensation — the sum of base salary plus target annual bonus opportunity; and
•Total target direct compensation — the sum of base salary plus target annual bonus opportunity plus target
long-term incentive opportunity.
The Compensation Committee considers, as one of many factors, each component of executive officer
compensation compared to the revenue size-adjusted market 50th percentile for two reasons:
•Benchmarking target compensation at the 50th percentile is consistent with the practice followed by a
majority of companies and is considered “best practice,” and
•Above-median compensation should be on a delivered actual basis, rather than a target basis, for
overachievement of target performance goals consistent with the Company’s “pay-for-performance”
philosophy.
Other factors considered by the Company and the Compensation Committee in determining executive
compensation levels are past and current target pay levels, internal equity considerations and individual
performance.
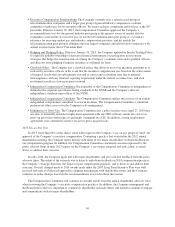
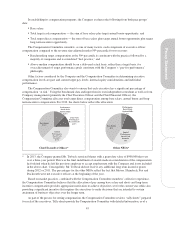
The Compensation Committee also wants to ensure that each executive has a significant percentage of
compensation “at risk.” Using the benchmark data and input from its own independent consultant as well as from
Company management (primarily the Chief Executive Officer and the Chief Financial Officer), the
Compensation Committee allocates total target direct compensation among base salary, annual bonus and long-
term incentive compensation. For 2013, the charts below reflect this allocation:
Performance-
Based Stock
Options/SARs
12.5%
Long-Term
Performance-
Based Awards
12.5%
Annual
Performance-
Based Cash
Incentive
37.5%
Base Salary
37.5%
Chief Executive Officer*
Performance-
Based Stock
Options/SARs
6%
Long-Term
Performance-
Based Awards
20%
Annual
Performance-
Based Cash
Incentive
33%
Base Salary
41%
Other NEOs*
* In 2013, the Company granted Mr. Torbeck restricted shares with a grant date value of $900,000 that vest
over a three-year period. This was the final installment of awards made in consideration of the compensation
he forfeited when he left his previous employer to accept employment with the Company and is not included
in the above chart. Consequently, Mr. Torbeck did not receive any additional long term incentive grants
during 2012 or 2011. The percentages for the other NEOs reflect the fact that Messrs. Heimbach, Fox and
Duckworth were not executive officers at the beginning of the year.
Based on market practices, combined with the Compensation Committee members’ collective experience,
the Compensation Committee believes that this allocation of pay among base salary and short- and long-term
incentive compensation provides appropriate motivation to achieve objectives set for the current year while also
providing a significant incentive that requires the executives to make decisions that are intended to sustain
attainment of business objectives over the longer term.
As part of the process for setting compensation, the Compensation Committee reviews “tally sheets” prepared
for each of the executives. Tally sheets provide the Compensation Committee with detailed information, as of a
45
Proxy Statement
