Cincinnati Bell 2013 Annual Report Download - page 184
Download and view the complete annual report
Please find page 184 of the 2013 Cincinnati Bell annual report below. You can navigate through the pages in the report by either clicking on the pages listed below, or by using the keyword search tool below to find specific information within the annual report.-
 1
1 -
2
-
3
-
4
-
5
-
6
-
7
-
8
-
9
-
10
-
11
-
12
-
13
-
14
-
15
-
16
-
17
-
18
-
19
-
20
-
21
-
22
-
23
-
24
-
25
-
26
-
27
-
28
-
29
-
30
-
31
-
32
-
33
-
34
-
35
-
36
-
37
-
38
-
39
-
40
-
41
-
42
-
43
-
44
-
45
-
46
-
47
-
48
-
49
-
50
-
51
-
52
-
53
-
54
-
55
-
56
-
57
-
58
-
59
-
60
-
61
-
62
-
63
-
64
-
65
-
66
-
67
-
68
-
69
-
70
-
71
-
72
-
73
-
74
-
75
-
76
-
77
-
78
-
79
-
80
-
81
-
82
-
83
-
84
-
85
-
86
-
87
-
88
-
89
-
90
-
91
-
92
-
93
-
94
-
95
-
96
-
97
-
98
-
99
-
100
-
101
-
102
-
103
-
104
-
105
-
106
-
107
-
108
-
109
-
110
-
111
-
112
-
113
-
114
-
115
-
116
-
117
-
118
-
119
-
120
-
121
-
122
-
123
-
124
-
125
-
126
-
127
-
128
-
129
-
130
-
131
-
132
-
133
-
134
-
135
-
136
-
137
-
138
-
139
-
140
-
141
-
142
-
143
-
144
-
145
-
146
-
147
-
148
-
149
-
150
-
151
-
152
-
153
-
154
-
155
-
156
-
157
-
158
-
159
-
160
-
161
-
162
-
163
-
164
-
165
-
166
-
167
-
168
-
169
-
170
-
171
-
172
-
173
-
 174
174 -
 175
175 -
 176
176 -
 177
177 -
 178
178 -
 179
179 -
 180
180 -
 181
181 -
 182
182 -
 183
183 -
 184
184 -
 185
185 -
 186
186 -
 187
187 -
 188
188 -
 189
189 -
 190
190 -
 191
191 -
 192
192 -
 193
193 -
 194
194 -
195
-
196
-
197
-
198
-
199
-
200
-
201
-
202
-
203
-
204
-
205
-
206
-
207
-
208
-
209
-
210
-
211
-
212
-
213
-
214
-
215
-
216
-
217
-
218
-
219
-
220
-
221
-
222
-
223
-
224
-
225
-
226
-
227
-
228
-
229
-
230
-
231
-
232
-
233
-
234
-
235
-
236
-
237
-
238
-
239
-
240
-
241
-
242
-
243
-
244
-
245
-
246
-
247
-
248
-
249
-
250
-
251
-
252
-
253
-
254
-
255
-
256
-
257
-
258
-
259
-
260
-
261
-
262
-
263
-
264
-
265
-
266
-
267
-
268
-
269
-
270
-
271
-
272
-
273
-
274
-
275
-
276
-
277
-
278
-
279
-
280
-
281
-
282
-
283
-
284
-
285
-
286
-
287
-
288
-
289
-
290
-
291
-
292
 |
 |

Plan Assets, Investment Policies and Strategies
The primary investment objective for the trusts holding the assets of the pension and postretirement plans is
preservation of capital with a reasonable amount of long-term growth and income without undue exposure to
risk. This is provided by a balanced strategy using fixed income and equity securities. The target allocations for
the pension plan assets are 61% equity securities, 33% investment grade fixed income securities and 6% in
pooled real estate funds. Equity securities are primarily held in the form of passively managed funds that seek to
track the performance of a benchmark index. Equity securities include investments in growth and value common
stocks of companies located in the United States, which represents approximately 78% of the equity securities
held by the pension plans at December 31, 2013 as well as stock of international companies located in both
developed and emerging markets around the world. Fixed income securities primarily include holdings of funds,
which generally invest in a variety of intermediate and long-term investment grade corporate bonds from
diversified industries. The postretirement plan assets are currently invested in a group insurance contract.
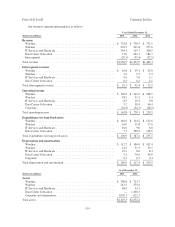
The fair values of the pension and postretirement plan assets at December 31, 2013 and 2012 by asset
category are as follows:
(dollars in millions)
December 31,
2013
Quoted Prices
in active
markets
Level 1
Significant
observable
inputs
Level 2
Significant
unobservable
inputs
Level 3
Mutual funds
U.S. equity index funds .......................... $201.4 $201.4 $— $ —
International equity index funds .................... 57.0 57.0 — —
Fixed income bond funds ......................... 109.8 109.8 — —
Fixed income short-term money market funds ........ 0.3 0.3 — —
Real estate pooled funds ............................ 30.8 — — 30.8
Group insurance contract ........................... 11.3 — — 11.3
Total ........................................... $410.6 $368.5 $— $42.1
(dollars in millions)
December 31,
2012
Quoted Prices
in active
markets
Level 1
Significant
observable
inputs
Level 2
Significant
unobservable
inputs
Level 3
Mutual funds
U.S. equity index funds .......................... $163.3 $163.3 $— $ —
International equity index funds .................... 49.8 49.8 — —
Fixed income bond funds ......................... 102.9 102.9 — —
Real estate pooled funds ............................ 27.8 — — 27.8
Group insurance contract ........................... 11.7 — — 11.7
Total ........................................... $355.5 $316.0 $— $39.5
The fair values of Level 1 investments are based on quoted prices in active markets. The fair values of Level
2 investments, which consist of funds that hold securities in active markets, are determined based on the net asset
value as reported by the fund manager.
The Level 3 investments consist of real estate pooled funds and a group insurance contract. The real estate
pooled funds are valued at the net asset values disclosed by the fund managers, which are based on estimated fair
values of the real estate investments using independent appraisal. The group insurance contract is valued at
contract value plus accrued interest, which approximates fair value.
104
Form 10-K Part II Cincinnati Bell Inc.