Cincinnati Bell 2013 Annual Report Download - page 50
Download and view the complete annual report
Please find page 50 of the 2013 Cincinnati Bell annual report below. You can navigate through the pages in the report by either clicking on the pages listed below, or by using the keyword search tool below to find specific information within the annual report.-
 1
1 -
2
-
3
-
4
-
5
-
6
-
7
-
8
-
9
-
10
-
11
-
12
-
13
-
14
-
15
-
16
-
17
-
18
-
19
-
20
-
21
-
22
-
23
-
24
-
25
-
26
-
27
-
28
-
29
-
30
-
31
-
32
-
33
-
34
-
35
-
36
-
37
-
38
-
39
-
 40
40 -
 41
41 -
 42
42 -
 43
43 -
 44
44 -
 45
45 -
 46
46 -
 47
47 -
 48
48 -
 49
49 -
 50
50 -
 51
51 -
 52
52 -
 53
53 -
 54
54 -
 55
55 -
 56
56 -
 57
57 -
 58
58 -
 59
59 -
 60
60 -
61
-
62
-
63
-
64
-
65
-
66
-
67
-
68
-
69
-
70
-
71
-
72
-
73
-
74
-
75
-
76
-
77
-
78
-
79
-
80
-
81
-
82
-
83
-
84
-
85
-
86
-
87
-
88
-
89
-
90
-
91
-
92
-
93
-
94
-
95
-
96
-
97
-
98
-
99
-
100
-
101
-
102
-
103
-
104
-
105
-
106
-
107
-
108
-
109
-
110
-
111
-
112
-
113
-
114
-
115
-
116
-
117
-
118
-
119
-
120
-
121
-
122
-
123
-
124
-
125
-
126
-
127
-
128
-
129
-
130
-
131
-
132
-
133
-
134
-
135
-
136
-
137
-
138
-
139
-
140
-
141
-
142
-
143
-
144
-
145
-
146
-
147
-
148
-
149
-
150
-
151
-
152
-
153
-
154
-
155
-
156
-
157
-
158
-
159
-
160
-
161
-
162
-
163
-
164
-
165
-
166
-
167
-
168
-
169
-
170
-
171
-
172
-
173
-
174
-
175
-
176
-
177
-
178
-
179
-
180
-
181
-
182
-
183
-
184
-
185
-
186
-
187
-
188
-
189
-
190
-
191
-
192
-
193
-
194
-
195
-
196
-
197
-
198
-
199
-
200
-
201
-
202
-
203
-
204
-
205
-
206
-
207
-
208
-
209
-
210
-
211
-
212
-
213
-
214
-
215
-
216
-
217
-
218
-
219
-
220
-
221
-
222
-
223
-
224
-
225
-
226
-
227
-
228
-
229
-
230
-
231
-
232
-
233
-
234
-
235
-
236
-
237
-
238
-
239
-
240
-
241
-
242
-
243
-
244
-
245
-
246
-
247
-
248
-
249
-
250
-
251
-
252
-
253
-
254
-
255
-
256
-
257
-
258
-
259
-
260
-
261
-
262
-
263
-
264
-
265
-
266
-
267
-
268
-
269
-
270
-
271
-
272
-
273
-
274
-
275
-
276
-
277
-
278
-
279
-
280
-
281
-
282
-
283
-
284
-
285
-
286
-
287
-
288
-
289
-
290
-
291
-
292
 |
 |

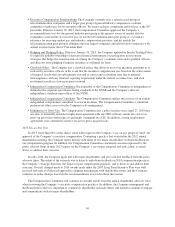
development of the Company leadership team, development of business opportunities and community
involvement/relationships. The Compensation Committee has discretion in evaluating the Chief Executive
Officer’s performance and may recommend to the full Board a discretionary increase or decrease to the Chief
Executive Officer’s final incentive award as the Compensation Committee believes is warranted.
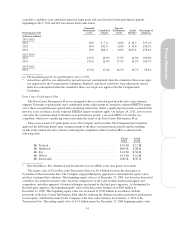
The table below shows the percentage of target annual incentive earned by each NEO for 2013 for each
performance measure and in total:
Named Executive Officer
Total Company
Revenue
Total Company
Adjusted
EBITDA
Individual
Performance
Total Annual
Incentive
Award
Theodore H. Torbeck .......................... 104% 103% 200% $949,950
David L. Heimbach ........................... 104% 103% 200% $404,484
Leigh R. Fox ................................. 104% 103% 200% $306,623
Christopher J. Wilson .......................... 104% 103% 150% $268,131
Joshua T. Duckworth .......................... 104% 103% 200% $ 86,023
Long-term Incentives
The long-term incentives granted to NEOs in 2013 consist of stock options or SARs and performance shares
or units, equally weighted in terms of grant-date fair value. Long-term incentives are intended to encourage the
Company’s executives to focus on and achieve the long-term (three-year) business goals of the Company and to
aid their development and retention through share ownership and recognition of future performance. An
executive’s realization of his or her long-term incentive means that the Company has also performed in
accordance with its plan over a long-term period. The total annual long-term incentive opportunity for each NEO
is established by the Compensation Committee in terms of dollars. In administering the long-term incentive
program, the Compensation Committee considers competitive market data (as discussed below) and the
recommendations of the Chief Executive Officer regarding each executive’s performance and specific individual
accomplishments. For each type of award, the number of options/SARs and performance shares/units to grant is
determined by dividing the approved award amount by the binomial value of one option/SAR for the half of the
award being made in options or SARs and the price of a share of common stock for the other half being awarded
in performance shares/units. The Compensation Committee’s policy is not to grant more than 2,000,000 shares
per year in connection with long-term incentive awards under the 2007 Long Term Incentive Plan.
Stock Options/SARs
Stock options/SARs granted to NEOs for 2013 are subject to the same performance vesting conditions as
performance share unit awards. Stock options/SARs directly align the executive’s interest with the shareholders’
interest because any actual realized value derived from stock options/SARs requires achievement of a specific
financial metric to vest and appreciation in the Company’s stock price to have value.
Performance Plan
Performance share or unit awards, which may be paid in common shares, cash, or a combination thereof, are
based on the achievement of specific Company quantitative goals over a three-year performance period. Such
awards are granted during the first quarter of each calendar year following finalization and approval by the full
Board of the one-year, two-year cumulative and three-year cumulative financial goal(s) for the next three-year
performance period. Beginning with 2014 awards, the vesting period is being changed to vest at the end of the
third year, with no interim vesting.
The threshold, target and superior performance levels are the same for each of the NEOs. For each
performance cycle, actual adjusted free cash flow and, commencing in 2012, actual unlevered cash return on
assets achieved must be at least 90% of the target goal in order to generate a threshold level payout equal to 75%
of the target award for each executive. Adjusted free cash flow and unlevered cash return one-year, two-year
40