Cincinnati Bell 2013 Annual Report Download - page 253
Download and view the complete annual report
Please find page 253 of the 2013 Cincinnati Bell annual report below. You can navigate through the pages in the report by either clicking on the pages listed below, or by using the keyword search tool below to find specific information within the annual report.-
 1
1 -
2
-
3
-
4
-
5
-
6
-
7
-
8
-
9
-
10
-
11
-
12
-
13
-
14
-
15
-
16
-
17
-
18
-
19
-
20
-
21
-
22
-
23
-
24
-
25
-
26
-
27
-
28
-
29
-
30
-
31
-
32
-
33
-
34
-
35
-
36
-
37
-
38
-
39
-
40
-
41
-
42
-
43
-
44
-
45
-
46
-
47
-
48
-
49
-
50
-
51
-
52
-
53
-
54
-
55
-
56
-
57
-
58
-
59
-
60
-
61
-
62
-
63
-
64
-
65
-
66
-
67
-
68
-
69
-
70
-
71
-
72
-
73
-
74
-
75
-
76
-
77
-
78
-
79
-
80
-
81
-
82
-
83
-
84
-
85
-
86
-
87
-
88
-
89
-
90
-
91
-
92
-
93
-
94
-
95
-
96
-
97
-
98
-
99
-
100
-
101
-
102
-
103
-
104
-
105
-
106
-
107
-
108
-
109
-
110
-
111
-
112
-
113
-
114
-
115
-
116
-
117
-
118
-
119
-
120
-
121
-
122
-
123
-
124
-
125
-
126
-
127
-
128
-
129
-
130
-
131
-
132
-
133
-
134
-
135
-
136
-
137
-
138
-
139
-
140
-
141
-
142
-
143
-
144
-
145
-
146
-
147
-
148
-
149
-
150
-
151
-
152
-
153
-
154
-
155
-
156
-
157
-
158
-
159
-
160
-
161
-
162
-
163
-
164
-
165
-
166
-
167
-
168
-
169
-
170
-
171
-
172
-
173
-
174
-
175
-
176
-
177
-
178
-
179
-
180
-
181
-
182
-
183
-
184
-
185
-
186
-
187
-
188
-
189
-
190
-
191
-
192
-
193
-
194
-
195
-
196
-
197
-
198
-
199
-
200
-
201
-
202
-
203
-
204
-
205
-
206
-
207
-
208
-
209
-
210
-
211
-
212
-
213
-
214
-
215
-
216
-
217
-
218
-
219
-
220
-
221
-
222
-
223
-
224
-
225
-
226
-
227
-
228
-
229
-
230
-
231
-
232
-
233
-
234
-
235
-
236
-
237
-
238
-
239
-
240
-
241
-
242
-
 243
243 -
 244
244 -
 245
245 -
 246
246 -
 247
247 -
 248
248 -
 249
249 -
 250
250 -
 251
251 -
 252
252 -
 253
253 -
 254
254 -
 255
255 -
 256
256 -
 257
257 -
 258
258 -
 259
259 -
 260
260 -
 261
261 -
 262
262 -
 263
263 -
264
-
265
-
266
-
267
-
268
-
269
-
270
-
271
-
272
-
273
-
274
-
275
-
276
-
277
-
278
-
279
-
280
-
281
-
282
-
283
-
284
-
285
-
286
-
287
-
288
-
289
-
290
-
291
-
292
 |
 |

Form 10-K/A Part IV Cincinnati Bell Inc.
CyrusOne Inc. and CyrusOne LP
NOTES TO CONSOLIDATED AND COMBINED FINANCIAL STATEMENTS—(continued)
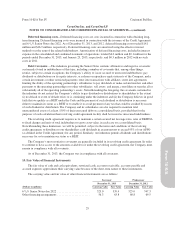
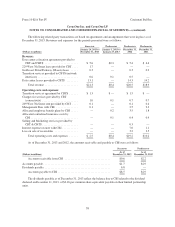
The following tables set forth the activity for the performance based awards for the period ended
December 31, 2013. The share/option count in these tables reflect the maximum amount of shares/options
available (200%) under the plan. The related compensation expense is being calculated using the amount of
shares/options that are probable under the plan (100%).
Performance Based-Restricted Stock
(in thousands, expect per share amounts) Shares
Weighted
average
grant date
fair value
per share
Granted ..................................................................... 125 $23.58
Forfeited .................................................................... (14) 23.58
Vested ..................................................................... — —
Shares outstanding at December 31, 2013 .......................................... 111 $23.58
Assuming these awards vest at a rate of 100%, the value of the restricted stock is equivalent to the
Company’s share price as of the grant date. These awards are expensed based on the grant date value if it is
probable that the performance conditions will be achieved. CyrusOne Inc. recognized stock-based compensation
expense of approximately $0.3 million for the period ended December 31, 2013, with no such expense for the
period ended January 23, 2013. As of December 31, 2013, we have unrecognized compensation expense of
approximately $1.0 million. This expense will be recognized over the remaining vesting period, or approximately
2.3 years.
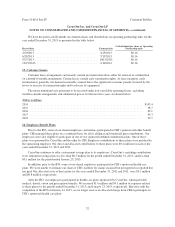
Performance Based-Stock Options
(in thousands, expect per option amounts) Options
Weighted
average
grant date
fair value
per option
Granted .................................................................... 95 $5.45
Forfeited ................................................................... (11) 5.45
Vested ..................................................................... — —
Shares outstanding at December 31, 2013 ......................................... 84 $5.45
These awards are expensed based on the grant date fair value if it is probable that the performance
conditions will be achieved. The fair value of each stock option is estimated using the Black-Scholes option-
pricing model. Significant assumptions used in the Black-Scholes model were six years for the expected term of
the stock options, 35% for the expected volatility, 0.92% for the risk-free rate of return and 3.4% for the expected
dividend yield. CyrusOne Inc. recognized stock-based compensation expense of approximately $0.1 million for
the period ended December 31, 2013, with no such expense for the period ended January 23, 2013. As of
December 31, 2013, we have unrecognized compensation expense of approximately $0.2 million. This expense
will be recognized over the remaining vesting period, or approximately 2.3 years. The exercise price for these
options is $23.58.
The following tables set forth the activity for the market based awards for the year ended December 31,
2013. The share/option count in these tables reflect the maximum amount of shares/options available under the
plan. The share/option count in these tables reflect the maximum amount of shares/options available
(200%) under the plan. The related compensation expense is being calculated using the amount of shares/options
that are probable under the plan (100%).
35
Form 10-K/A