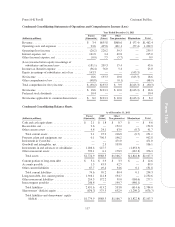
Cincinnati Bell 2013 Annual Report Download - page 191
Download and view the complete annual report
Please find page 191 of the 2013 Cincinnati Bell annual report below. You can navigate through the pages in the report by either clicking on the pages listed below, or by using the keyword search tool below to find specific information within the annual report.-
 1
1 -
2
-
3
-
4
-
5
-
6
-
7
-
8
-
9
-
10
-
11
-
12
-
13
-
14
-
15
-
16
-
17
-
18
-
19
-
20
-
21
-
22
-
23
-
24
-
25
-
26
-
27
-
28
-
29
-
30
-
31
-
32
-
33
-
34
-
35
-
36
-
37
-
38
-
39
-
40
-
41
-
42
-
43
-
44
-
45
-
46
-
47
-
48
-
49
-
50
-
51
-
52
-
53
-
54
-
55
-
56
-
57
-
58
-
59
-
60
-
61
-
62
-
63
-
64
-
65
-
66
-
67
-
68
-
69
-
70
-
71
-
72
-
73
-
74
-
75
-
76
-
77
-
78
-
79
-
80
-
81
-
82
-
83
-
84
-
85
-
86
-
87
-
88
-
89
-
90
-
91
-
92
-
93
-
94
-
95
-
96
-
97
-
98
-
99
-
100
-
101
-
102
-
103
-
104
-
105
-
106
-
107
-
108
-
109
-
110
-
111
-
112
-
113
-
114
-
115
-
116
-
117
-
118
-
119
-
120
-
121
-
122
-
123
-
124
-
125
-
126
-
127
-
128
-
129
-
130
-
131
-
132
-
133
-
134
-
135
-
136
-
137
-
138
-
139
-
140
-
141
-
142
-
143
-
144
-
145
-
146
-
147
-
148
-
149
-
150
-
151
-
152
-
153
-
154
-
155
-
156
-
157
-
158
-
159
-
160
-
161
-
162
-
163
-
164
-
165
-
166
-
167
-
168
-
169
-
170
-
171
-
172
-
173
-
174
-
175
-
176
-
177
-
178
-
179
-
180
-
 181
181 -
 182
182 -
 183
183 -
 184
184 -
 185
185 -
 186
186 -
 187
187 -
 188
188 -
 189
189 -
 190
190 -
 191
191 -
 192
192 -
 193
193 -
 194
194 -
 195
195 -
 196
196 -
 197
197 -
 198
198 -
 199
199 -
 200
200 -
 201
201 -
202
-
203
-
204
-
205
-
206
-
207
-
208
-
209
-
210
-
211
-
212
-
213
-
214
-
215
-
216
-
217
-
218
-
219
-
220
-
221
-
222
-
223
-
224
-
225
-
226
-
227
-
228
-
229
-
230
-
231
-
232
-
233
-
234
-
235
-
236
-
237
-
238
-
239
-
240
-
241
-
242
-
243
-
244
-
245
-
246
-
247
-
248
-
249
-
250
-
251
-
252
-
253
-
254
-
255
-
256
-
257
-
258
-
259
-
260
-
261
-
262
-
263
-
264
-
265
-
266
-
267
-
268
-
269
-
270
-
271
-
272
-
273
-
274
-
275
-
276
-
277
-
278
-
279
-
280
-
281
-
282
-
283
-
284
-
285
-
286
-
287
-
288
-
289
-
290
-
291
-
292
 |
 |

Form 10-K Part II Cincinnati Bell Inc.
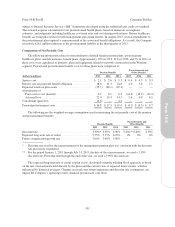
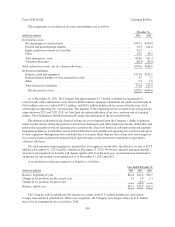
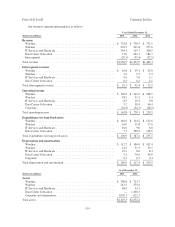
Time-Based Restricted Awards
Awards granted to employees generally vest in one-third increments over a period of three years. Awards
granted to directors vest on the third anniversary of the grant date. The following table summarizes our time-
based restricted award activity:
2013 2012 2011
(in thousands, except per share amounts) Shares
Weighted-
Average
Exercise
Price Per
Share Shares
Weighted-
Average
Exercise
Price Per
Share Shares
Weighted-
Average
Exercise
Price Per
Share
Non-vested at January 1, ...................... 1,298 $3.11 872 $2.89 229 $3.36
Granted ................................... 279 4.72 725 3.26 711 2.85
Vested .................................... (454) 3.03 (299) 2.83 (45) 4.69
Forfeited .................................. (79) 3.40 — — (23) 3.03
Non-vested at December 31, ................... 1,044 $3.55 1,298 $3.11 872 $2.89
(dollars in millions)
Compensation expense for the year .............. $ 1.7 $ 1.5 $0.8
Tax benefit related to compensation expense ...... $ (0.6) $ (0.6) $(0.3)
Grant date fair value of awards vested ........... $ 1.4 $ 0.8 $0.2
As of December 31, 2013, there was $1.7 million of unrecognized compensation expense related to these
shares, which is expected to be recognized over a weighted-average period of approximately one year.
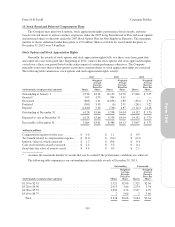
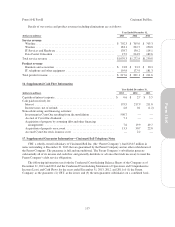
Cash Settled and Other Awards
The Company granted 531,000 and 789,000 cash-settled stock appreciation rights awards in 2012 and 2011,
respectively, with grant date values of $0.8 million and $0.9 million, respectively. A Black-Scholes pricing
model was utilized to determine the fair value of these awards at the date of grant. For awards granted in 2012
and 2011, the weighted-average fair value per share was $1.32 and $1.18, respectively. The final payments of
these awards will be indexed to the percentage change in the Company’s stock price from the date of grant. At
December 31, 2013, there was $0.1 million of unrecognized compensation, which is expected to be recognized
over one year. The aggregate intrinsic value of outstanding and exercisable awards at December 31, 2013 was
$0.9 million.
The Company also granted cash-payment performance awards in 2012 and 2011 with base awards of $2.3
million, and $1.0 million, respectively, with the final award payment indexed to the percentage change in the
Company’s stock price from the date of grant. In 2013, we recorded a $0.2 million benefit related to these
awards. In 2012 and 2011, we recorded expenses of $4.4 million and $1.8 million, respectively.
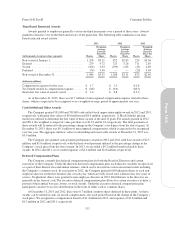
Deferred Compensation Plans
The Company currently has deferred compensation plans for both the Board of Directors and certain
executives of the Company. Under the directors deferred compensation plan, each director can defer receipt of all
or a part of their director fees and annual retainers, which can be invested in various investment funds including
the Company’s common stock. In years prior to 2012, the Company granted 6,000 phantom shares to each non-
employee director on the first business day of each year, which are fully vested once a director has five years of
service. No phantom shares were granted to non-employee directors in 2013. Distributions to the directors are
generally in the form of cash. The executive deferred compensation plan allows for certain executives to defer a
portion of their annual base pay, bonus, or stock awards. Under the executive deferred compensation plan,
participants can elect to receive distributions in the form of either cash or common shares.
At December 31, 2013 and 2012, there were 0.7 million common shares deferred in these plans. As these
awards can be settled in cash, we record compensation costs each period based on the change in the Company’s
stock price. We recognized a compensation benefit of $1.4 million in 2013, and expenses of $1.8 million and
$0.3 million in 2012 and 2011, respectively.
111
Form 10-K