Cincinnati Bell 2013 Annual Report Download - page 194
Download and view the complete annual report
Please find page 194 of the 2013 Cincinnati Bell annual report below. You can navigate through the pages in the report by either clicking on the pages listed below, or by using the keyword search tool below to find specific information within the annual report.-
 1
1 -
2
-
3
-
4
-
5
-
6
-
7
-
8
-
9
-
10
-
11
-
12
-
13
-
14
-
15
-
16
-
17
-
18
-
19
-
20
-
21
-
22
-
23
-
24
-
25
-
26
-
27
-
28
-
29
-
30
-
31
-
32
-
33
-
34
-
35
-
36
-
37
-
38
-
39
-
40
-
41
-
42
-
43
-
44
-
45
-
46
-
47
-
48
-
49
-
50
-
51
-
52
-
53
-
54
-
55
-
56
-
57
-
58
-
59
-
60
-
61
-
62
-
63
-
64
-
65
-
66
-
67
-
68
-
69
-
70
-
71
-
72
-
73
-
74
-
75
-
76
-
77
-
78
-
79
-
80
-
81
-
82
-
83
-
84
-
85
-
86
-
87
-
88
-
89
-
90
-
91
-
92
-
93
-
94
-
95
-
96
-
97
-
98
-
99
-
100
-
101
-
102
-
103
-
104
-
105
-
106
-
107
-
108
-
109
-
110
-
111
-
112
-
113
-
114
-
115
-
116
-
117
-
118
-
119
-
120
-
121
-
122
-
123
-
124
-
125
-
126
-
127
-
128
-
129
-
130
-
131
-
132
-
133
-
134
-
135
-
136
-
137
-
138
-
139
-
140
-
141
-
142
-
143
-
144
-
145
-
146
-
147
-
148
-
149
-
150
-
151
-
152
-
153
-
154
-
155
-
156
-
157
-
158
-
159
-
160
-
161
-
162
-
163
-
164
-
165
-
166
-
167
-
168
-
169
-
170
-
171
-
172
-
173
-
174
-
175
-
176
-
177
-
178
-
179
-
180
-
181
-
182
-
183
-
 184
184 -
 185
185 -
 186
186 -
 187
187 -
 188
188 -
 189
189 -
 190
190 -
 191
191 -
 192
192 -
 193
193 -
 194
194 -
 195
195 -
 196
196 -
 197
197 -
 198
198 -
 199
199 -
 200
200 -
 201
201 -
 202
202 -
 203
203 -
 204
204 -
205
-
206
-
207
-
208
-
209
-
210
-
211
-
212
-
213
-
214
-
215
-
216
-
217
-
218
-
219
-
220
-
221
-
222
-
223
-
224
-
225
-
226
-
227
-
228
-
229
-
230
-
231
-
232
-
233
-
234
-
235
-
236
-
237
-
238
-
239
-
240
-
241
-
242
-
243
-
244
-
245
-
246
-
247
-
248
-
249
-
250
-
251
-
252
-
253
-
254
-
255
-
256
-
257
-
258
-
259
-
260
-
261
-
262
-
263
-
264
-
265
-
266
-
267
-
268
-
269
-
270
-
271
-
272
-
273
-
274
-
275
-
276
-
277
-
278
-
279
-
280
-
281
-
282
-
283
-
284
-
285
-
286
-
287
-
288
-
289
-
290
-
291
-
292
 |
 |

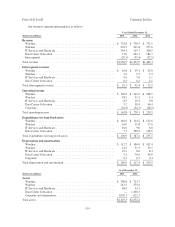
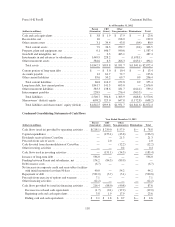
Our business segment information is as follows:
Year Ended December 31,
(dollars in millions) 2013 2012 2011
Revenue
Wireline ....................................................... $ 724.8 $ 730.5 $ 732.1
Wireless ....................................................... 201.5 241.8 277.6
IT Services and Hardware ......................................... 344.1 315.7 300.5
Data Center Colocation ........................................... 15.6 221.3 184.7
Intersegment ................................................... (29.1) (35.4) (32.5)
Total revenue ..................................................... $1,256.9 $1,473.9 $1,462.4
Intersegment revenue
Wireline ....................................................... $ 16.8 $ 19.1 $ 23.0
Wireless ....................................................... 2.3 2.3 2.3
IT Services and Hardware ......................................... 9.6 7.6 5.1
Data Center Colocation ........................................... 0.4 6.4 2.1
Total intersegment revenue .......................................... $ 29.1 $ 35.4 $ 32.5
Operating income
Wireline ....................................................... $ 190.2 $ 212.9 $ 228.5
Wireless ....................................................... 18.2 51.2 3.3
IT Services and Hardware ......................................... 8.5 10.3 9.8
Data Center Colocation ........................................... 3.2 30.4 46.4
Corporate ...................................................... (56.3) (34.7) (28.5)
Total operating income ............................................. $ 163.8 $ 270.1 $ 259.5
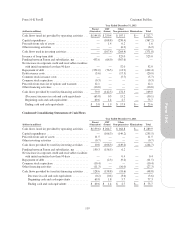
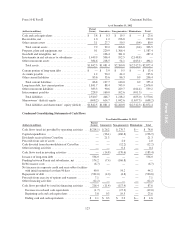
Expenditures for long-lived assets
Wireline ....................................................... $ 162.6 $ 114.2 $ 112.6
Wireless ....................................................... 16.0 15.8 17.6
IT Services and Hardware ......................................... 10.6 9.0 6.8
Data Center Colocation ........................................... 7.7 228.2 118.5
Total expenditures for long-lived assets ................................ $ 196.9 $ 367.2 $ 255.5
Depreciation and amortization
Wireline ....................................................... $ 112.2 $ 106.0 $ 102.4
Wireless ....................................................... 41.2 31.9 33.5
IT Services and Hardware ......................................... 10.5 8.6 8.4
Data Center Colocation ........................................... 5.2 70.6 54.8
Corporate ...................................................... 0.5 0.3 0.4
Total depreciation and amortization ................................... $ 169.6 $ 217.4 $ 199.5
As of December 31,
(dollars in millions) 2013 2012
Assets
Wireline ....................................................... $ 780.8 $ 723.7
Wireless ....................................................... 247.5 275.6
IT Services and Hardware ......................................... 48.9 43.3
Data Center Colocation ........................................... — 1,208.5
Corporate and eliminations ........................................ 1,030.1 621.3
Total assets ...................................................... $2,107.3 $2,872.4
114
Form 10-K Part II Cincinnati Bell Inc.