Cincinnati Bell 2013 Annual Report Download - page 122
Download and view the complete annual report
Please find page 122 of the 2013 Cincinnati Bell annual report below. You can navigate through the pages in the report by either clicking on the pages listed below, or by using the keyword search tool below to find specific information within the annual report.-
 1
1 -
2
-
3
-
4
-
5
-
6
-
7
-
8
-
9
-
10
-
11
-
12
-
13
-
14
-
15
-
16
-
17
-
18
-
19
-
20
-
21
-
22
-
23
-
24
-
25
-
26
-
27
-
28
-
29
-
30
-
31
-
32
-
33
-
34
-
35
-
36
-
37
-
38
-
39
-
40
-
41
-
42
-
43
-
44
-
45
-
46
-
47
-
48
-
49
-
50
-
51
-
52
-
53
-
54
-
55
-
56
-
57
-
58
-
59
-
60
-
61
-
62
-
63
-
64
-
65
-
66
-
67
-
68
-
69
-
70
-
71
-
72
-
73
-
74
-
75
-
76
-
77
-
78
-
79
-
80
-
81
-
82
-
83
-
84
-
85
-
86
-
87
-
88
-
89
-
90
-
91
-
92
-
93
-
94
-
95
-
96
-
97
-
98
-
99
-
100
-
101
-
102
-
103
-
104
-
105
-
106
-
107
-
108
-
109
-
110
-
111
-
 112
112 -
 113
113 -
 114
114 -
 115
115 -
 116
116 -
 117
117 -
 118
118 -
 119
119 -
 120
120 -
 121
121 -
 122
122 -
 123
123 -
 124
124 -
 125
125 -
 126
126 -
 127
127 -
 128
128 -
 129
129 -
 130
130 -
 131
131 -
 132
132 -
133
-
134
-
135
-
136
-
137
-
138
-
139
-
140
-
141
-
142
-
143
-
144
-
145
-
146
-
147
-
148
-
149
-
150
-
151
-
152
-
153
-
154
-
155
-
156
-
157
-
158
-
159
-
160
-
161
-
162
-
163
-
164
-
165
-
166
-
167
-
168
-
169
-
170
-
171
-
172
-
173
-
174
-
175
-
176
-
177
-
178
-
179
-
180
-
181
-
182
-
183
-
184
-
185
-
186
-
187
-
188
-
189
-
190
-
191
-
192
-
193
-
194
-
195
-
196
-
197
-
198
-
199
-
200
-
201
-
202
-
203
-
204
-
205
-
206
-
207
-
208
-
209
-
210
-
211
-
212
-
213
-
214
-
215
-
216
-
217
-
218
-
219
-
220
-
221
-
222
-
223
-
224
-
225
-
226
-
227
-
228
-
229
-
230
-
231
-
232
-
233
-
234
-
235
-
236
-
237
-
238
-
239
-
240
-
241
-
242
-
243
-
244
-
245
-
246
-
247
-
248
-
249
-
250
-
251
-
252
-
253
-
254
-
255
-
256
-
257
-
258
-
259
-
260
-
261
-
262
-
263
-
264
-
265
-
266
-
267
-
268
-
269
-
270
-
271
-
272
-
273
-
274
-
275
-
276
-
277
-
278
-
279
-
280
-
281
-
282
-
283
-
284
-
285
-
286
-
287
-
288
-
289
-
290
-
291
-
292
 |
 |
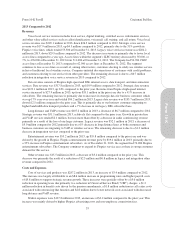
In 2013, $0.7 million of expense was recognized to account for future employee separations. In 2012, a
reversal of previously recognized expense of $1.2 million was recorded due to changes in estimates of employee
separation costs recognized in the prior year.
Capital Expenditures
Capital expenditures were $10.6 million in 2013 compared to $9.0 million in 2012. Capital expenditures
were higher in 2013 due to increased managed service projects.
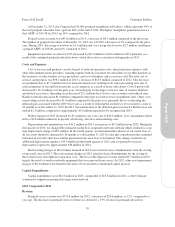
2012 Compared to 2011
Revenue
Strategic managed and professional services revenue totaled $109.0 million in 2012, up 18% from the prior
year due largely to increased customer demand for staff augmentation and managed service arrangements.
Integration services totaled $206.7 million down from $208.0 million in 2011. The decrease is primarily due to a
$1.4 million decrease in telecom and IT equipment distribution revenue which primarily reflects the cyclical
fluctuation in capital spending by our enterprise customers. Integration managed and professional services totaled
$2.1 million in 2012 compared to $2.0 million in 2011.
Costs and Expenses
Cost of services and products was $255.7 million in 2012, an increase of $12.7 million, or 5%, compared to
2011. The increase was largely driven by higher payroll, contract services and other costs incurred to support the
growth in managed and professional services revenue.
SG&A expenses were $42.3 million in 2012, an increase of $4.9 million, or 13%, from the prior year. This
increase was largely attributable to the integration of certain functions associated with the Cincinnati-based data
center business into the Data Center Colocation segment in 2012, which resulted in comparatively higher payroll
costs being incurred by IT Services and Hardware.
Depreciation and amortization expense for 2012 of $8.6 million was comparable to that in 2011.
In 2012, a reversal of previously recognized expense of $1.2 million was recognized due to changes in
estimates of employee separation costs recognized in the prior year. Restructuring charges of $1.9 million were
recorded in 2011 primarily related to employee separation obligations associated with the continued integration
of certain functions into the Wireline segment.
Capital Expenditures
Capital expenditures were $9.0 million in 2012 compared to $6.8 million in 2011. Capital expenditures were
higher in 2012 due to increased managed service projects.
42
Form 10-K Part II Cincinnati Bell Inc.