BP 2013 Annual Report Download - page 98
Download and view the complete annual report
Please find page 98 of the 2013 BP annual report below. You can navigate through the pages in the report by either clicking on the pages listed below, or by using the keyword search tool below to find specific information within the annual report.-
 1
1 -
2
-
3
-
4
-
5
-
6
-
7
-
8
-
9
-
10
-
11
-
12
-
13
-
14
-
15
-
16
-
17
-
18
-
19
-
20
-
21
-
22
-
23
-
24
-
25
-
26
-
27
-
28
-
29
-
30
-
31
-
32
-
33
-
34
-
35
-
36
-
37
-
38
-
39
-
40
-
41
-
42
-
43
-
44
-
45
-
46
-
47
-
48
-
49
-
50
-
51
-
52
-
53
-
54
-
55
-
56
-
57
-
58
-
59
-
60
-
61
-
62
-
63
-
64
-
65
-
66
-
67
-
68
-
69
-
70
-
71
-
72
-
73
-
74
-
75
-
76
-
77
-
78
-
79
-
80
-
81
-
82
-
83
-
84
-
85
-
86
-
87
-
 88
88 -
 89
89 -
 90
90 -
 91
91 -
 92
92 -
 93
93 -
 94
94 -
 95
95 -
 96
96 -
 97
97 -
 98
98 -
 99
99 -
 100
100 -
 101
101 -
 102
102 -
 103
103 -
 104
104 -
 105
105 -
 106
106 -
 107
107 -
 108
108 -
109
-
110
-
111
-
112
-
113
-
114
-
115
-
116
-
117
-
118
-
119
-
120
-
121
-
122
-
123
-
124
-
125
-
126
-
127
-
128
-
129
-
130
-
131
-
132
-
133
-
134
-
135
-
136
-
137
-
138
-
139
-
140
-
141
-
142
-
143
-
144
-
145
-
146
-
147
-
148
-
149
-
150
-
151
-
152
-
153
-
154
-
155
-
156
-
157
-
158
-
159
-
160
-
161
-
162
-
163
-
164
-
165
-
166
-
167
-
168
-
169
-
170
-
171
-
172
-
173
-
174
-
175
-
176
-
177
-
178
-
179
-
180
-
181
-
182
-
183
-
184
-
185
-
186
-
187
-
188
-
189
-
190
-
191
-
192
-
193
-
194
-
195
-
196
-
197
-
198
-
199
-
200
-
201
-
202
-
203
-
204
-
205
-
206
-
207
-
208
-
209
-
210
-
211
-
212
-
213
-
214
-
215
-
216
-
217
-
218
-
219
-
220
-
221
-
222
-
223
-
224
-
225
-
226
-
227
-
228
-
229
-
230
-
231
-
232
-
233
-
234
-
235
-
236
-
237
-
238
-
239
-
240
-
241
-
242
-
243
-
244
-
245
-
246
-
247
-
248
-
249
-
250
-
251
-
252
-
253
-
254
-
255
-
256
-
257
-
258
-
259
-
260
-
261
-
262
-
263
-
264
-
265
-
266
-
267
-
268
-
269
-
270
-
271
-
272
-
273
-
274
-
275
-
276
-
277
-
278
-
279
-
280
-
281
-
282
-
283
-
284
-
285
-
286
-
287
-
288
 |
 |

BP Annual Report and Form 20-F 201394
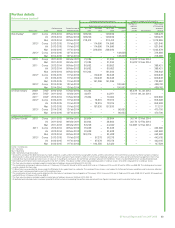
Performance shares (audited)
Share element interests Interests vested in 2013 and 2014
Performance
period
Date of award of
performance shares
Potential maximum performance sharesaNumber of
ordinary
shares
vested Vesting date
Face value
of the
award £
At 1 Jan
2013
Awarded
2013
At 31 Dec
2013
Awarded
2014
Bob Dudleyb2010-2012 09 Feb 2010 581,082 – – – 0 – –
2011-2013 09 Mar 2011 1,330,332 –1,330,332 –596,028cMarch 2014 –
2012-2014d08 Mar 2012 1,343,712 –1,343,712 – – – 6,637,937
2013-2015d11 Feb 2013 –1,384,026 1,384,026 – – – 6,297,318
2014-2016d12 Feb 2014 – – – 1,304,922 – – 6,354,970
Iain Conn 2008-2013e13 Feb 2008 133,452 – – – 145,489 07 Feb 2013 –
2010-2012 09 Feb 2010 656,813 – – – 0 – –
2011-2013 09 Mar 2011 623,025 –623,025 –283,920 March 2014 –
2012-2014d08 Mar 2012 660,633 – 660,633 – – – 3,263,527
2013-2015d11 Feb 2013 –694,688 694,688 – – – 3,16 0,8 30
2014-2016d12 Feb 2014 – – – 6 6 0,128 – – 3,214,823
Dr Brian Gilvary 2010-2012f15 Mar 2010 60,000 – – – 65,414c15 Jan 2013 –
2011-2013f14 Mar 2011 6 7,5 0 0 –6 7,5 0 0 –76,726c09 Jan 2014 –
2010-2012g15 Mar 2010 22,500 – – – 0 – –
2011-2013g14 Mar 2011 22,500 – 22,500 – 25,824c06 Feb 2014 –
2012-2014d08 Mar 2012 624,434 –624,434 – – – 3,084,704
2013-2015d11 Feb 2013 –6 37, 413 6 37,413 – – – 2,900,229
2014-2016d12 Feb 2014 – – – 605,544 – – 2,948,999
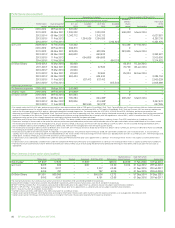
Former executive directors
Dr Anthony Hayward 2010-2012 09 Feb 2010 303,948h– – – 0 – –
Andrew Inglis 2010-2012 09 Feb 2010 218,938h– – – 0 – –
Dr Byron Groteb2010-2012 09 Feb 2010 801,894 – – – 0 – –
2011-2013 09 Mar 2011 785,394 –654,498h–293,232cMarch 2014 –
2012-2014d08 Mar 2012 828,936 –414,468h– – – 2,047,472
2013-2015d11 Feb 2013 –853,650 142,278h– – – 6 47, 36 5
a For awards under the 2010-2012 plan, performance conditions were measured one-third on TSR against ExxonMobil, Shell, Total, ConocoPhillips and Chevron and two-thirds on a balanced scorecard
of underlying performance. For awards under the 2011-2013 plan, performance conditions are measured 50% on TSR against ExxonMobil, Shell, Total and Chevron; 20% on reserves replacement
against the same peer group; and 30% against a balanced scorecard of strategic imperatives. For awards under the 2012-2014, 2013-2015 and 2014-2016 plans, performance conditions are
measured one-third on TSR against ExxonMobil, Shell, Total and Chevron; one-third on operating cash flow; and one-third on a balanced scorecard of strategic imperatives. Each performance period
ends on 31 December of the third year. There is no identified overall minimum vesting threshold level but to comply with UK regulations a value of 30%, which is conditional on the TSR, reserves
replacement ratio and one of the strategic imperatives reaching the minimum threshold, has been calculated.
b Bob Dudley and Dr Byron Grote received awards in the form of ADSs. The above numbers reflect calculated equivalents in ordinary shares. One ADS is equivalent to six ordinary shares.
c Represents vestings of shares made at the end of the relevant performance period based on performance achieved under rules of the plan and includes reinvested dividends on the shares vested.
The market price of each share at the vesting date of 15 January 2013 was £4.58, at 9 January 2014 was £4.97 and at 6 February 2014 was £4.77. For the assumed vestings dated March 2014 a
price of £4.69 per ordinary share and $45.52 per ADS has been used. These are the average prices from the fourth quarter of 2013.
d The market price at closing of ordinary shares on 8 March 2012 was £4.94, on 11 February 2013 was £4.55 and for ADSs was $43.01 and on 12 February 2014 was £4.87 and for ADSs was $48.38.
The sterling value has been used to calculate the face value.
e Restricted award under share element of EDIP. As reported in the 2007 directors’ remuneration report in February 2008, the committee awarded Iain Conn restricted shares, in two tranches of
133,452 shares each and on vesting include re-invested dividends on the shares vested. The total vesting of the first tranche was 155,695 shares at £4.91 on 22 February 2011. The remaining award,
noted above, vested on 7 February 2013, the fifth anniversary of the award at £4.58.
f Dr Brian Gilvary was conditionally awarded shares under the Executive Performance Plan prior to his appointment as a director. The vesting of these shares is not subject to further performance
conditions.
g Dr Brian Gilvary was conditionally awarded shares under the Competitive Performance Plan prior to his appointment as a director. The vesting of these shares is subject to performance conditions.
h Potential maximum of performance shares element have been pro-rated to reflect actual service during the performance period and these figures have been used to calculate the face value as
appropriate.
Share interests in share option plans (audited)
Option type At 1 Jan 2013 Granted Exercised At 31 Dec 2013 Option price
Market price at
date of exercise
Date from which
first exercisable Expiry date
Bob DudleyaBP SOP 17,835 –17,835b–$38.10 $43.99 17 Feb 2006 16 Feb 2013
Iain Conn SAYE 605 –605c– £4.20 £4.54 01 Sep 2012 28 Feb 2013
SAYE 3,017 – – 3,017 £3.68 –01 Sep 2016 28 Feb 2017
SAYE 797 – – 797 £3.16 –01 Sep 2015 28 Feb 2016
Dr Brian Gilvary BP 2011 500,000 – – 500,000 £3.72 –07 Sep 2014 07 Sep 2021
SAYE 4,191 – – 4,191 £3.68 –01 Sep 2016 28 Feb 2017
The closing market prices of an ordinary share and of an ADS on 31 December 2013 were £4.88 and $48.61 respectively.
During 2013 the highest market prices were £4.93 and $48.61 respectively and the lowest market prices were £4.31 and $40.19 respectively.
BP SOP = BP Share Option Plan. These options were granted to Bob Dudley prior to his appointment as a director and are not subject to performance conditions.
BP 2011 = BP 2011 Plan. These options were granted to Dr Brian Gilvary prior to his appointment as a director and are not subject to performance conditions.
SAYE = Save As You Earn all employee share scheme.
a Numbers shown are ADSs under option. One ADS is equivalent to six ordinary shares.
b Options exercised on 6 February 2013. Market price at closing for information. Shares were sold in tranches after the exercise of options at an average price of $43.62 per ADS.
c Options exercised on 13 February 2013. Market price at closing for information. Shares were retained after the exercise of options.