BP 2013 Annual Report Download - page 16
Download and view the complete annual report
Please find page 16 of the 2013 BP annual report below. You can navigate through the pages in the report by either clicking on the pages listed below, or by using the keyword search tool below to find specific information within the annual report.-
 1
1 -
2
-
3
-
4
-
5
-
 6
6 -
 7
7 -
 8
8 -
 9
9 -
 10
10 -
 11
11 -
 12
12 -
 13
13 -
 14
14 -
 15
15 -
 16
16 -
 17
17 -
 18
18 -
 19
19 -
 20
20 -
 21
21 -
 22
22 -
 23
23 -
 24
24 -
 25
25 -
 26
26 -
27
-
28
-
29
-
30
-
31
-
32
-
33
-
34
-
35
-
36
-
37
-
38
-
39
-
40
-
41
-
42
-
43
-
44
-
45
-
46
-
47
-
48
-
49
-
50
-
51
-
52
-
53
-
54
-
55
-
56
-
57
-
58
-
59
-
60
-
61
-
62
-
63
-
64
-
65
-
66
-
67
-
68
-
69
-
70
-
71
-
72
-
73
-
74
-
75
-
76
-
77
-
78
-
79
-
80
-
81
-
82
-
83
-
84
-
85
-
86
-
87
-
88
-
89
-
90
-
91
-
92
-
93
-
94
-
95
-
96
-
97
-
98
-
99
-
100
-
101
-
102
-
103
-
104
-
105
-
106
-
107
-
108
-
109
-
110
-
111
-
112
-
113
-
114
-
115
-
116
-
117
-
118
-
119
-
120
-
121
-
122
-
123
-
124
-
125
-
126
-
127
-
128
-
129
-
130
-
131
-
132
-
133
-
134
-
135
-
136
-
137
-
138
-
139
-
140
-
141
-
142
-
143
-
144
-
145
-
146
-
147
-
148
-
149
-
150
-
151
-
152
-
153
-
154
-
155
-
156
-
157
-
158
-
159
-
160
-
161
-
162
-
163
-
164
-
165
-
166
-
167
-
168
-
169
-
170
-
171
-
172
-
173
-
174
-
175
-
176
-
177
-
178
-
179
-
180
-
181
-
182
-
183
-
184
-
185
-
186
-
187
-
188
-
189
-
190
-
191
-
192
-
193
-
194
-
195
-
196
-
197
-
198
-
199
-
200
-
201
-
202
-
203
-
204
-
205
-
206
-
207
-
208
-
209
-
210
-
211
-
212
-
213
-
214
-
215
-
216
-
217
-
218
-
219
-
220
-
221
-
222
-
223
-
224
-
225
-
226
-
227
-
228
-
229
-
230
-
231
-
232
-
233
-
234
-
235
-
236
-
237
-
238
-
239
-
240
-
241
-
242
-
243
-
244
-
245
-
246
-
247
-
248
-
249
-
250
-
251
-
252
-
253
-
254
-
255
-
256
-
257
-
258
-
259
-
260
-
261
-
262
-
263
-
264
-
265
-
266
-
267
-
268
-
269
-
270
-
271
-
272
-
273
-
274
-
275
-
276
-
277
-
278
-
279
-
280
-
281
-
282
-
283
-
284
-
285
-
286
-
287
-
288
 |
 |

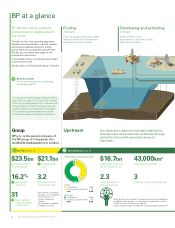
We aim to create shareholder value across the
hydrocarbon value chain.
Our business model
Our businesses
For more information on our upstream,
downstream and alternative energy
businesses, see pages 25, 31 and 37
respectively.
A rising global population and increasing levels of
prosperity are set to create growing demand for
energy for years to come. We can help to meet
that demand by producing oil and gas safely and
reliably.
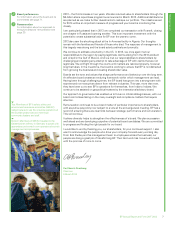
We believe that the best way to achieve
sustainable success as a group is to act in the
long-term interests of our shareholders, our
partners and society. We aim to create value for
our investors and benefits for the communities
and societies in which we operate, with the
responsible supply of energy playing a vital role
in economic development.
Every stage of the hydrocarbon value chain
offers opportunities for us to create value – both
through the successful execution of activities
that are core to our industry, and through the
application of our own distinctive strengths and
capabilities in performing those activities. In
renewable energy our focus is on integrating
biofuels into the hydrocarbon value chain, and
on wind operations in the US.
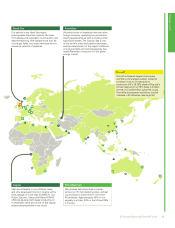
Our approach spans everything from exploration
to marketing. Integration across the group allows
us to share functional excellence more efficiently
across areas such as safety and operational risk,
environmental and social practices, procurement,
technology and treasury management.
A relentless focus on safety remains the top
priority for everyone at BP. Rigorous
management of risk helps to protect the people
at the front line, the places in which we operate
and the value we create. We understand that
operating in politically complex regions and
technically demanding geographies requires
particular sensitivity to local environments.
Toledo refinery in Ohio has been in constant
operation since 1919. The facility has the capacity
to process up to 160,000 barrels of crude per day.
The redevelopment project at Valhall was
one of BP’s most complex field expansion
developments and gives the field a further
40-year design life.
Our business model
Finding oil
and gas
First, we acquire the rights to
explore for oil and gas. Through
our exploration activities we are
able to renew our portfolio,
discover new resources and
replenish our development
options.
Developing and
extracting
When we find hydrocarbon resources,
we create value by seeking to
progress them into proved reserves
or by divesting if they do not fit with
our strategy. If we believe developing
and producing the reserves will be
advantageous for BP, we produce
the oil and gas, then sell it to the
market or distribute it to our
downstream facilities.
Transporting
and trading
We move oil and gas through
pipelines and by ship, truck and train.
Using our trading and supply skills
and knowledge, we buy and sell at
each stage in the value chain. Our
presence across major trading hubs
gives us a good understanding of
regional and international markets
and allows us to create value
through entrepreneurial trading.
Manufacturing and
marketing
Using our technology and expertise,
we manufacture fuels and products,
creating value by seeking to operate
a high-quality portfolio of well-
located assets safely, reliably and
efficiently. We market our products
to consumers and other end-users
and add value through the strength
of our brands.
Our illustrated business model see page 2.
BP Annual Report and Form 20-F 201312