BP 2013 Annual Report Download - page 159
Download and view the complete annual report
Please find page 159 of the 2013 BP annual report below. You can navigate through the pages in the report by either clicking on the pages listed below, or by using the keyword search tool below to find specific information within the annual report.-
 1
1 -
2
-
3
-
4
-
5
-
6
-
7
-
8
-
9
-
10
-
11
-
12
-
13
-
14
-
15
-
16
-
17
-
18
-
19
-
20
-
21
-
22
-
23
-
24
-
25
-
26
-
27
-
28
-
29
-
30
-
31
-
32
-
33
-
34
-
35
-
36
-
37
-
38
-
39
-
40
-
41
-
42
-
43
-
44
-
45
-
46
-
47
-
48
-
49
-
50
-
51
-
52
-
53
-
54
-
55
-
56
-
57
-
58
-
59
-
60
-
61
-
62
-
63
-
64
-
65
-
66
-
67
-
68
-
69
-
70
-
71
-
72
-
73
-
74
-
75
-
76
-
77
-
78
-
79
-
80
-
81
-
82
-
83
-
84
-
85
-
86
-
87
-
88
-
89
-
90
-
91
-
92
-
93
-
94
-
95
-
96
-
97
-
98
-
99
-
100
-
101
-
102
-
103
-
104
-
105
-
106
-
107
-
108
-
109
-
110
-
111
-
112
-
113
-
114
-
115
-
116
-
117
-
118
-
119
-
120
-
121
-
122
-
123
-
124
-
125
-
126
-
127
-
128
-
129
-
130
-
131
-
132
-
133
-
134
-
135
-
136
-
137
-
138
-
139
-
140
-
141
-
142
-
143
-
144
-
145
-
146
-
147
-
148
-
 149
149 -
 150
150 -
 151
151 -
 152
152 -
 153
153 -
 154
154 -
 155
155 -
 156
156 -
 157
157 -
 158
158 -
 159
159 -
 160
160 -
 161
161 -
 162
162 -
 163
163 -
 164
164 -
 165
165 -
 166
166 -
 167
167 -
 168
168 -
 169
169 -
170
-
171
-
172
-
173
-
174
-
175
-
176
-
177
-
178
-
179
-
180
-
181
-
182
-
183
-
184
-
185
-
186
-
187
-
188
-
189
-
190
-
191
-
192
-
193
-
194
-
195
-
196
-
197
-
198
-
199
-
200
-
201
-
202
-
203
-
204
-
205
-
206
-
207
-
208
-
209
-
210
-
211
-
212
-
213
-
214
-
215
-
216
-
217
-
218
-
219
-
220
-
221
-
222
-
223
-
224
-
225
-
226
-
227
-
228
-
229
-
230
-
231
-
232
-
233
-
234
-
235
-
236
-
237
-
238
-
239
-
240
-
241
-
242
-
243
-
244
-
245
-
246
-
247
-
248
-
249
-
250
-
251
-
252
-
253
-
254
-
255
-
256
-
257
-
258
-
259
-
260
-
261
-
262
-
263
-
264
-
265
-
266
-
267
-
268
-
269
-
270
-
271
-
272
-
273
-
274
-
275
-
276
-
277
-
278
-
279
-
280
-
281
-
282
-
283
-
284
-
285
-
286
-
287
-
288
 |
 |

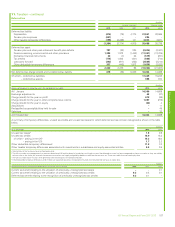
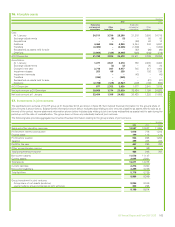
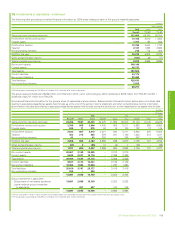
9. Operating leases – continued
The future minimum lease payments at 31 December 2013, before deducting related rental income from operating sub-leases of $223 million (2012
$271 million), are shown in the table below. This does not include future contingent rentals. Where the lease rentals are dependent on a variable factor,
the future minimum lease payments are based on the factor as at inception of the lease.
$ million
Future minimum lease payments 2013 2012
Payable within
1 year 5,188 4,533
2 to 5 years 10,408 9,735
Thereafter 3,590 4,195
19,186 18,463
The group enters into operating leases of ships, plant and machinery, commercial vehicles and land and buildings. Typical durations of the leases are as
follows:
Years
Ships up to 15
Plant and machinery up to 10
Commercial vehicles up to 15
Land and buildings up to 40
The group has entered into a number of structured operating leases for ships and in most cases the lease rental payments vary with market interest
rates. The variable portion of the lease payments above or below the amount based on the market interest rate prevailing at inception of the lease is
treated as contingent rental expense. The group also routinely enters into bareboat charters, time-charters and voyage-charters for ships on standard
industry terms.
The most significant items of plant and machinery hired under operating leases are drilling rigs used in the Upstream segment. At 31 December 2013,
the future minimum lease payments relating to drilling rigs amounted to $8,776 million (2012 $8,527 million).
Commercial vehicles hired under operating leases are primarily railcars. Retail service station sites and office accommodation are the main items inthe
land and buildings category.
The terms and conditions of these operating leases do not impose any significant financial restrictions on the group. Some of the leases of ships and
buildings allow for renewals at BP’s option, and some of the group’s operating leases contain escalation clauses.
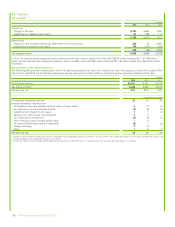
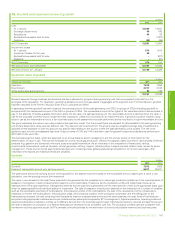
10. Exploration for and evaluation of oil and natural gas resources
The following financial information represents the amounts included within the group totals relating to activity associated with the exploration for and
evaluation of oil and natural gas resources. All such activity is recorded within the Upstream segment.
$ million
2013 2012 2011
Exploration and evaluation costs
Exploration expenditure written offa2,710 745 1,024
Other exploration costs 731 730 496
Exploration expense for the year 3,441 1,475 1,520
Impairment losses 253 –7
Impairment reversals –(42) –
Intangible assets – exploration and appraisal expenditure 20,865 23,434 20,433
Liabilities 212 287 306
Net assets 20,653 23,147 20,127
Capital expenditure 4,464 5,176 8,926
Net cash used in operating activities 731 730 496
Net cash used in investing activities 4,275 5,010 8,571
a2013 included an $845-million write-off relating to the value ascribed to block BM-CAL-13 offshore Brazil as a result of the Pitanga exploration well not encountering commercial quantities of oil or gas
and a $257-million write-off of costs relating to the Risha concession in Jordan as our exploration activities did not establish the technical basis for a development project in the concession. For further
information see Upstream – Exploration on page 28.
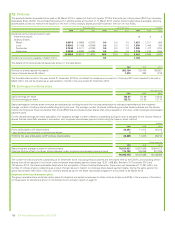
The carrying amount, by location, of exploration and appraisal expenditure capitalized as intangible assets at 31 December 2013 is shown in the table
below.
Carrying amount Location
$1-2 billion Angola; US – North America gas
$2-3 billion Canada; Egypt; India
$3-4 billion Brazil
$4-5 billion US – Gulf of Mexico
Financial statements
BP Annual Report and Form 20-F 2013 155