BP 2013 Annual Report Download - page 181
Download and view the complete annual report
Please find page 181 of the 2013 BP annual report below. You can navigate through the pages in the report by either clicking on the pages listed below, or by using the keyword search tool below to find specific information within the annual report.-
 1
1 -
2
-
3
-
4
-
5
-
6
-
7
-
8
-
9
-
10
-
11
-
12
-
13
-
14
-
15
-
16
-
17
-
18
-
19
-
20
-
21
-
22
-
23
-
24
-
25
-
26
-
27
-
28
-
29
-
30
-
31
-
32
-
33
-
34
-
35
-
36
-
37
-
38
-
39
-
40
-
41
-
42
-
43
-
44
-
45
-
46
-
47
-
48
-
49
-
50
-
51
-
52
-
53
-
54
-
55
-
56
-
57
-
58
-
59
-
60
-
61
-
62
-
63
-
64
-
65
-
66
-
67
-
68
-
69
-
70
-
71
-
72
-
73
-
74
-
75
-
76
-
77
-
78
-
79
-
80
-
81
-
82
-
83
-
84
-
85
-
86
-
87
-
88
-
89
-
90
-
91
-
92
-
93
-
94
-
95
-
96
-
97
-
98
-
99
-
100
-
101
-
102
-
103
-
104
-
105
-
106
-
107
-
108
-
109
-
110
-
111
-
112
-
113
-
114
-
115
-
116
-
117
-
118
-
119
-
120
-
121
-
122
-
123
-
124
-
125
-
126
-
127
-
128
-
129
-
130
-
131
-
132
-
133
-
134
-
135
-
136
-
137
-
138
-
139
-
140
-
141
-
142
-
143
-
144
-
145
-
146
-
147
-
148
-
149
-
150
-
151
-
152
-
153
-
154
-
155
-
156
-
157
-
158
-
159
-
160
-
161
-
162
-
163
-
164
-
165
-
166
-
167
-
168
-
169
-
170
-
 171
171 -
 172
172 -
 173
173 -
 174
174 -
 175
175 -
 176
176 -
 177
177 -
 178
178 -
 179
179 -
 180
180 -
 181
181 -
 182
182 -
 183
183 -
 184
184 -
 185
185 -
 186
186 -
 187
187 -
 188
188 -
 189
189 -
 190
190 -
 191
191 -
192
-
193
-
194
-
195
-
196
-
197
-
198
-
199
-
200
-
201
-
202
-
203
-
204
-
205
-
206
-
207
-
208
-
209
-
210
-
211
-
212
-
213
-
214
-
215
-
216
-
217
-
218
-
219
-
220
-
221
-
222
-
223
-
224
-
225
-
226
-
227
-
228
-
229
-
230
-
231
-
232
-
233
-
234
-
235
-
236
-
237
-
238
-
239
-
240
-
241
-
242
-
243
-
244
-
245
-
246
-
247
-
248
-
249
-
250
-
251
-
252
-
253
-
254
-
255
-
256
-
257
-
258
-
259
-
260
-
261
-
262
-
263
-
264
-
265
-
266
-
267
-
268
-
269
-
270
-
271
-
272
-
273
-
274
-
275
-
276
-
277
-
278
-
279
-
280
-
281
-
282
-
283
-
284
-
285
-
286
-
287
-
288
 |
 |

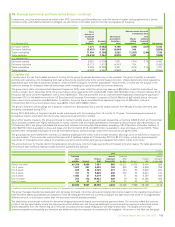
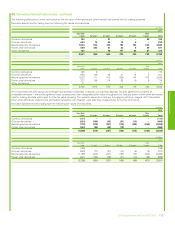
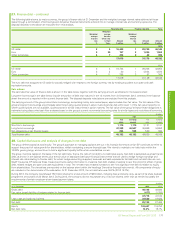
27. Finance debt – continued
The following table shows, by major currency, the group’s finance debt at 31 December and the weighted average interest rates achieved at those
dates through a combination of borrowings and derivative financial instruments entered into to manage interest rate and currency exposures. The
disposal deposits noted above are excluded from this analysis.
Fixed rate debt Floating rate debt Total
Weighted
average
interest
rate
%
Weighted
average
time for
which rate
is fixed
Years
Amount
$ million
Weighted
average
interest
rate
%
Amount
$ million
Amount
$ million
2013
US dollar 3 4 16,405 1 29,740 46,145
Euro 5 30 157 2 1,396 1,553
Other currencies 4 7 454 2 40 494
17,016 31,176 48,192
2012
US dollar 3 4 16,744 1 26,208 42,952
Euro 5 2 20 1 4,854 4,874
Other currencies 4 11 255 3 87 342
17,019 31,149 48,168
The euro debt not swapped to US dollar is naturally hedged with respect to the foreign currency risk by holding equivalent euro cash and cash
equivalent amounts.
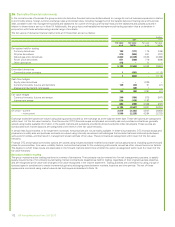
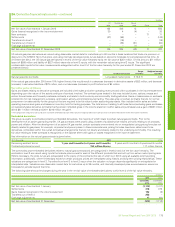
Fair values
The estimated fair value of finance debt is shown in the table below together with the carrying amount as reflected in the balance sheet.
Long-term borrowings in the table below include the portion of debt that matures in the 12 months from 31 December 2013, whereas in the balance
sheet the amount is reported within current finance debt. The disposal deposits noted above are excluded from this analysis.
The carrying amount of the group’s short-term borrowings, comprising mainly commercial paper, approximates their fair value. The fair values of the
group’s long-term borrowings are principally determined using quoted prices in active markets (and so fall within level 1 of the fair value hierarchy)or,
where quoted prices are not available, quoted prices for similar instruments in active markets. The fair value of the group’s finance lease obligations is
estimated using discounted cash flow analyses based on the group’s current incremental borrowing rates for similar types and maturities of borrowing.
$ million
2013 2012
Fair
value
Carrying
amount
Fair
value
Carrying
amount
Short-term borrowings 1,110 1,110 3,131 3,131
Long-term borrowings 47,398 46,547 45,969 44,653
Net obligations under finance leases 654 535 520 384
Total finance debt 49,162 48,192 49,620 48,168
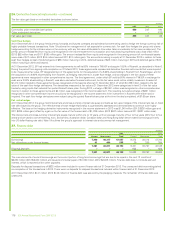
28. Capital disclosures and analysis of changes in net debt
The group defines capital as total equity. The group’s approach to managing capital is set out in its financial framework which BP continues to refine to
support the pursuit of value growth for shareholders, whilst maintaining a secure financial base. We intend to maintain a net debt ratio within the
10-20% gearing range, and continue to hold a significant liquidity buffer while uncertainties remain.
The group monitors capital on the basis of the net debt ratio, that is, the ratio of net debt to net debt plus equity. Net debt is calculated as gross finance
debt, as shown in the balance sheet, plus the fair value of associated derivative financial instruments that are used to hedge foreign exchange and
interest rate risks relating to finance debt, for which hedge accounting is applied, less cash and cash equivalents. Net debt and net debt ratio are non-
GAAP measures. BP believes these measures provide useful information to investors. Net debt enables investors to see the economic effect of gross
debt, related hedges and cash and cash equivalents in total. The net debt ratio enables investors to see how significant net debt is relative to equity
from shareholders. The derivatives are reported on the balance sheet within the headings ‘Derivative financial instruments’. All components of equity
are included in the denominator of the calculation. At 31 December 2013, the net debt ratio was 16.2% (2012 18.7%).
During 2013, the company repurchased 753 million shares for a total amount of $5.5 billion, including fees and stamp duty, as part of its share buyback
programme announced on 22 March 2013. During 2012, the company did not repurchase any of its own shares, other than as needed to satisfy the
requirements of certain employee share-based payment plans.
$ million
At 31 December 2013 2012
Gross debt 48,192 48,800
Fair value (asset) liability of hedges related to finance debt (477) (1,700)
47,715 47,100
Less: cash and cash equivalents 22,520 19,635
Net debt 25,195 27,465
Equity 130,407 119,752
Net debt ratio 16.2% 18.7%
Financial statements
BP Annual Report and Form 20-F 2013 177